Lab 3: Sensors
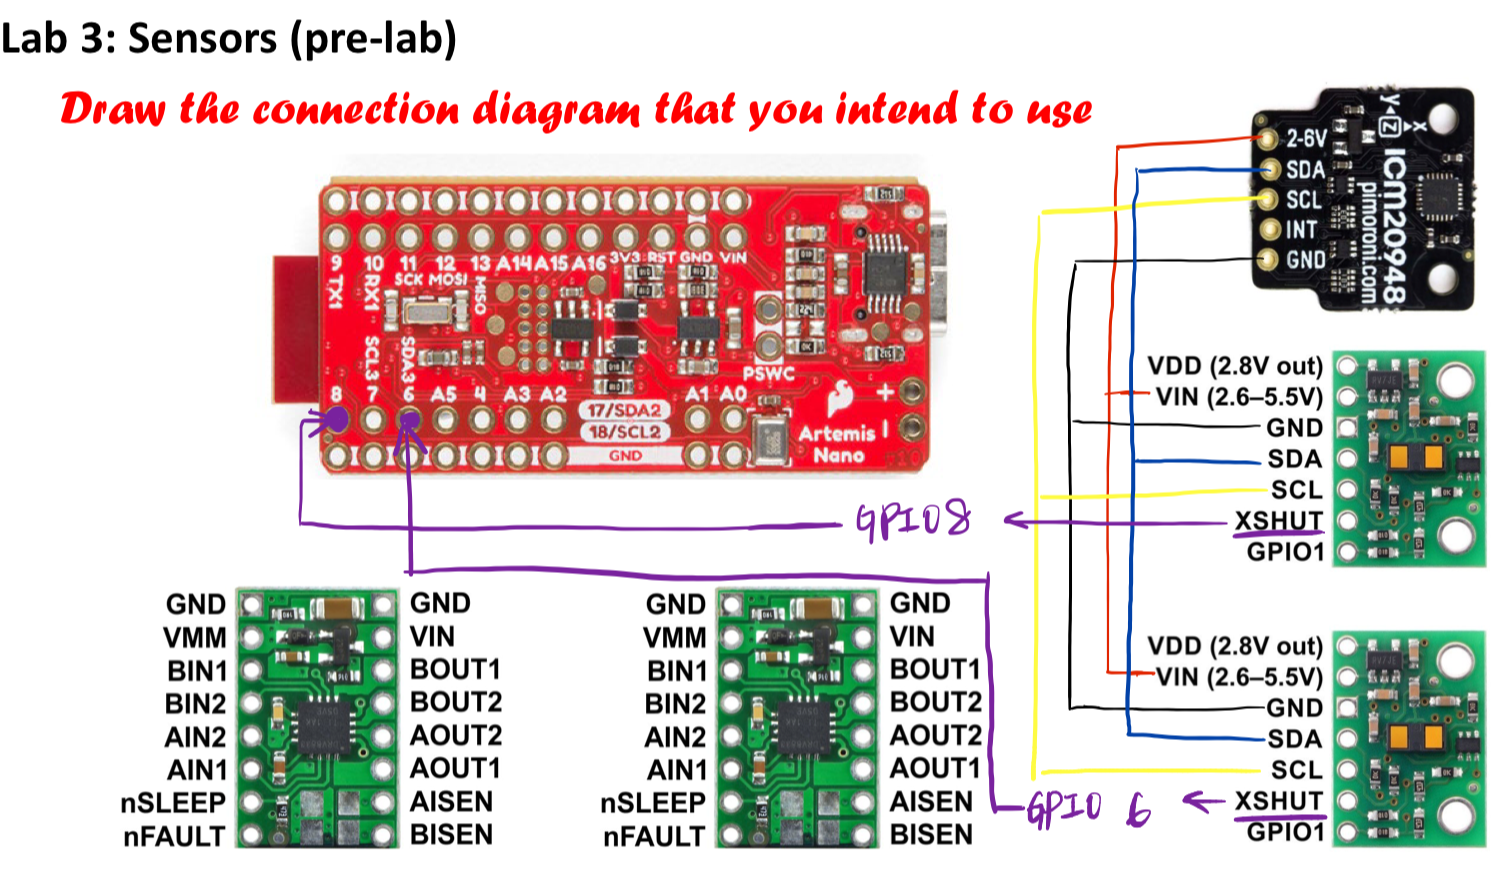
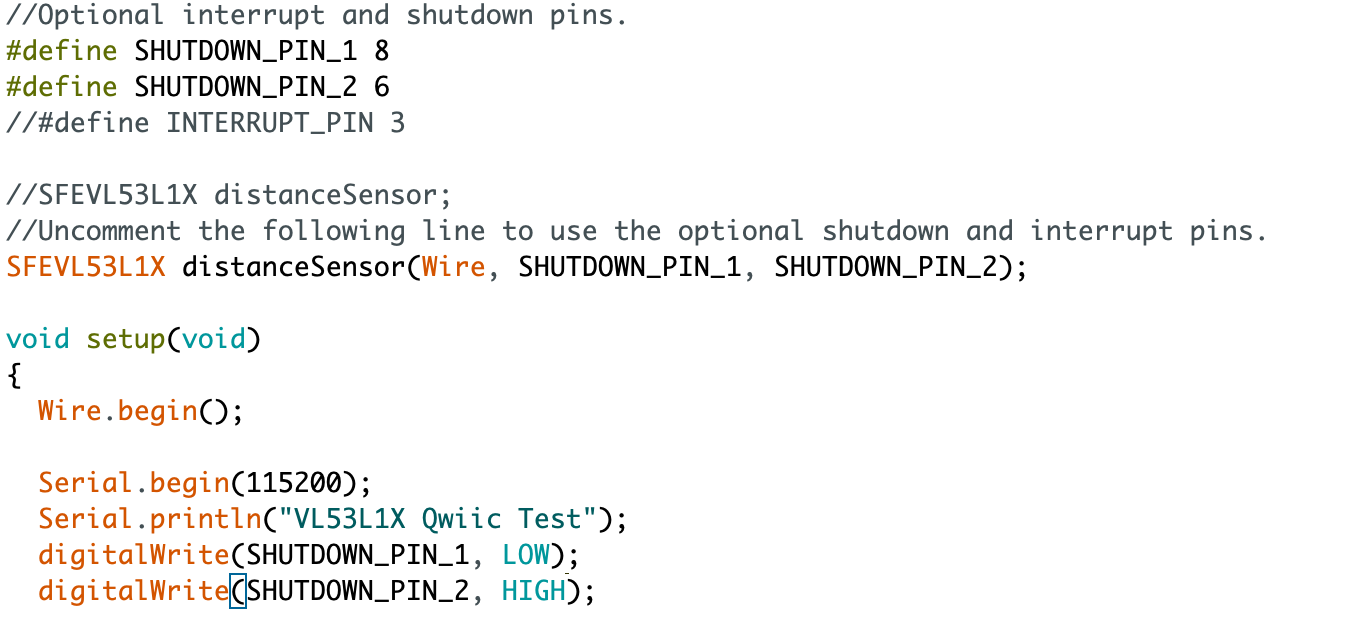
For the prelab, I planned out the connections between two time-of-flight sensors and one IMU unit as the sketch shown below. Vin of the two ToF sensors and IMU are connected to the same Artemis input, so do all the other SDA, SCL, and ground connections. The shutdown pins of the time of flight sensors are connected to GPIO pins of the Artemis board because they will run on the same address at the same time, which is not ideal to control any one of them individually.
Part A: Time of Flight Sensors
-
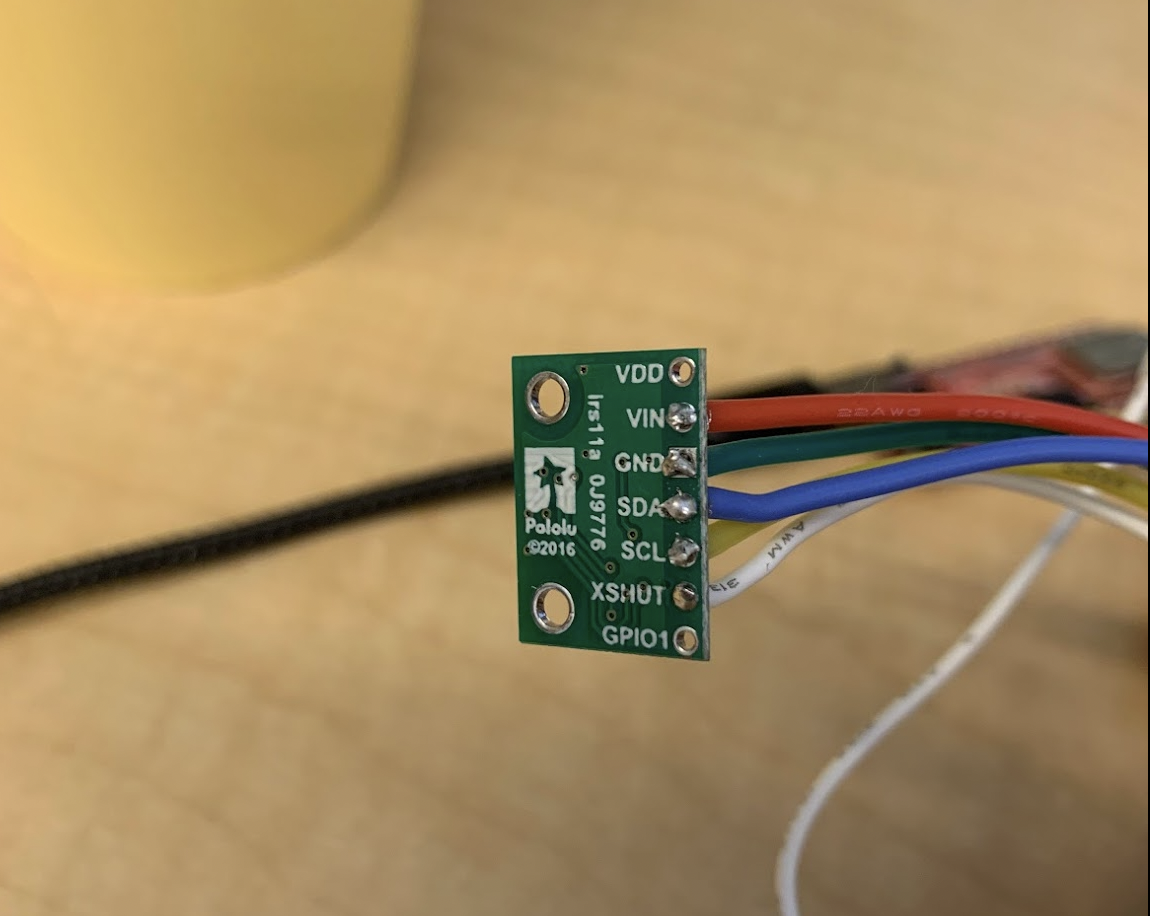
I soldered the connections of VL53L1X by using the qwiic cables based on the sketch from the prelab. Since we have to hook up more than one sensor to this connection, I twisted two wires together on both ends to fit into the electrical contact hole of the ToF sensor. The extra wire is used to daisy-chain the second ToF sensor and the IMU.
-
After soldering one ToF sensor to the Artemis, I ran the example wire file to test the I2C connection. It showed 0x29 detected in the serial monitor, while it is also followed by ‘No device detected’ in the next output. The address matched with my expectation, and the ‘No device detected’ was due to the lack of extra sensors in the I2C connection.

-
Discuss the pros and cons of three distance range modes: short, medium, and long.
According to the datasheet, distance mode is a parameter to optimize the settings and tuning for the best ranging performance. The performance is evaluated by the potential application distance range and the ambient light conditions. The short distance mode has less effect from the ambient while the long one got affected the most by it. However, the long one has the maximum distance range (4 m), which is more suitable for the final robot application if the robot needs to move around freely in a room. -
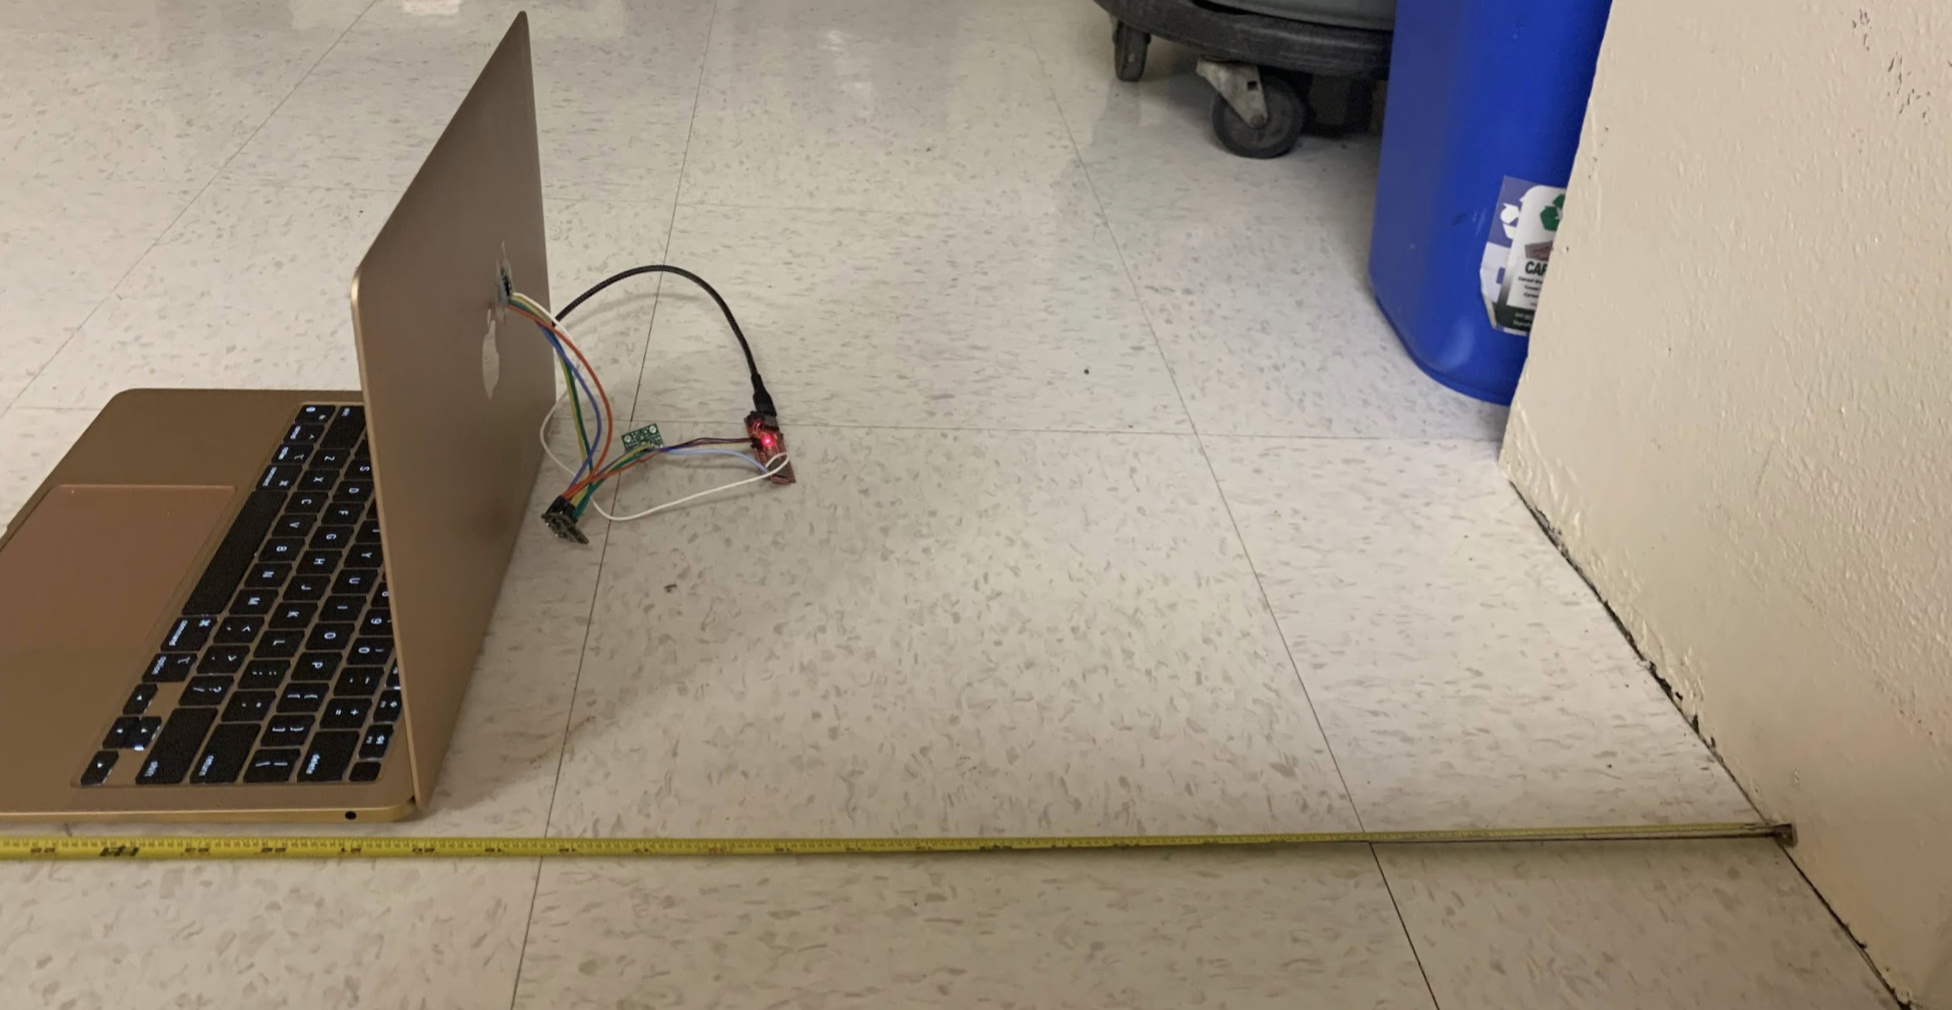
I chose the long distance mode to test the ToF sensor by running the ReadDistance example from the library. I taped the ToF sensor at the cover of my computer and measured the distance against a wooden door and a white wall.
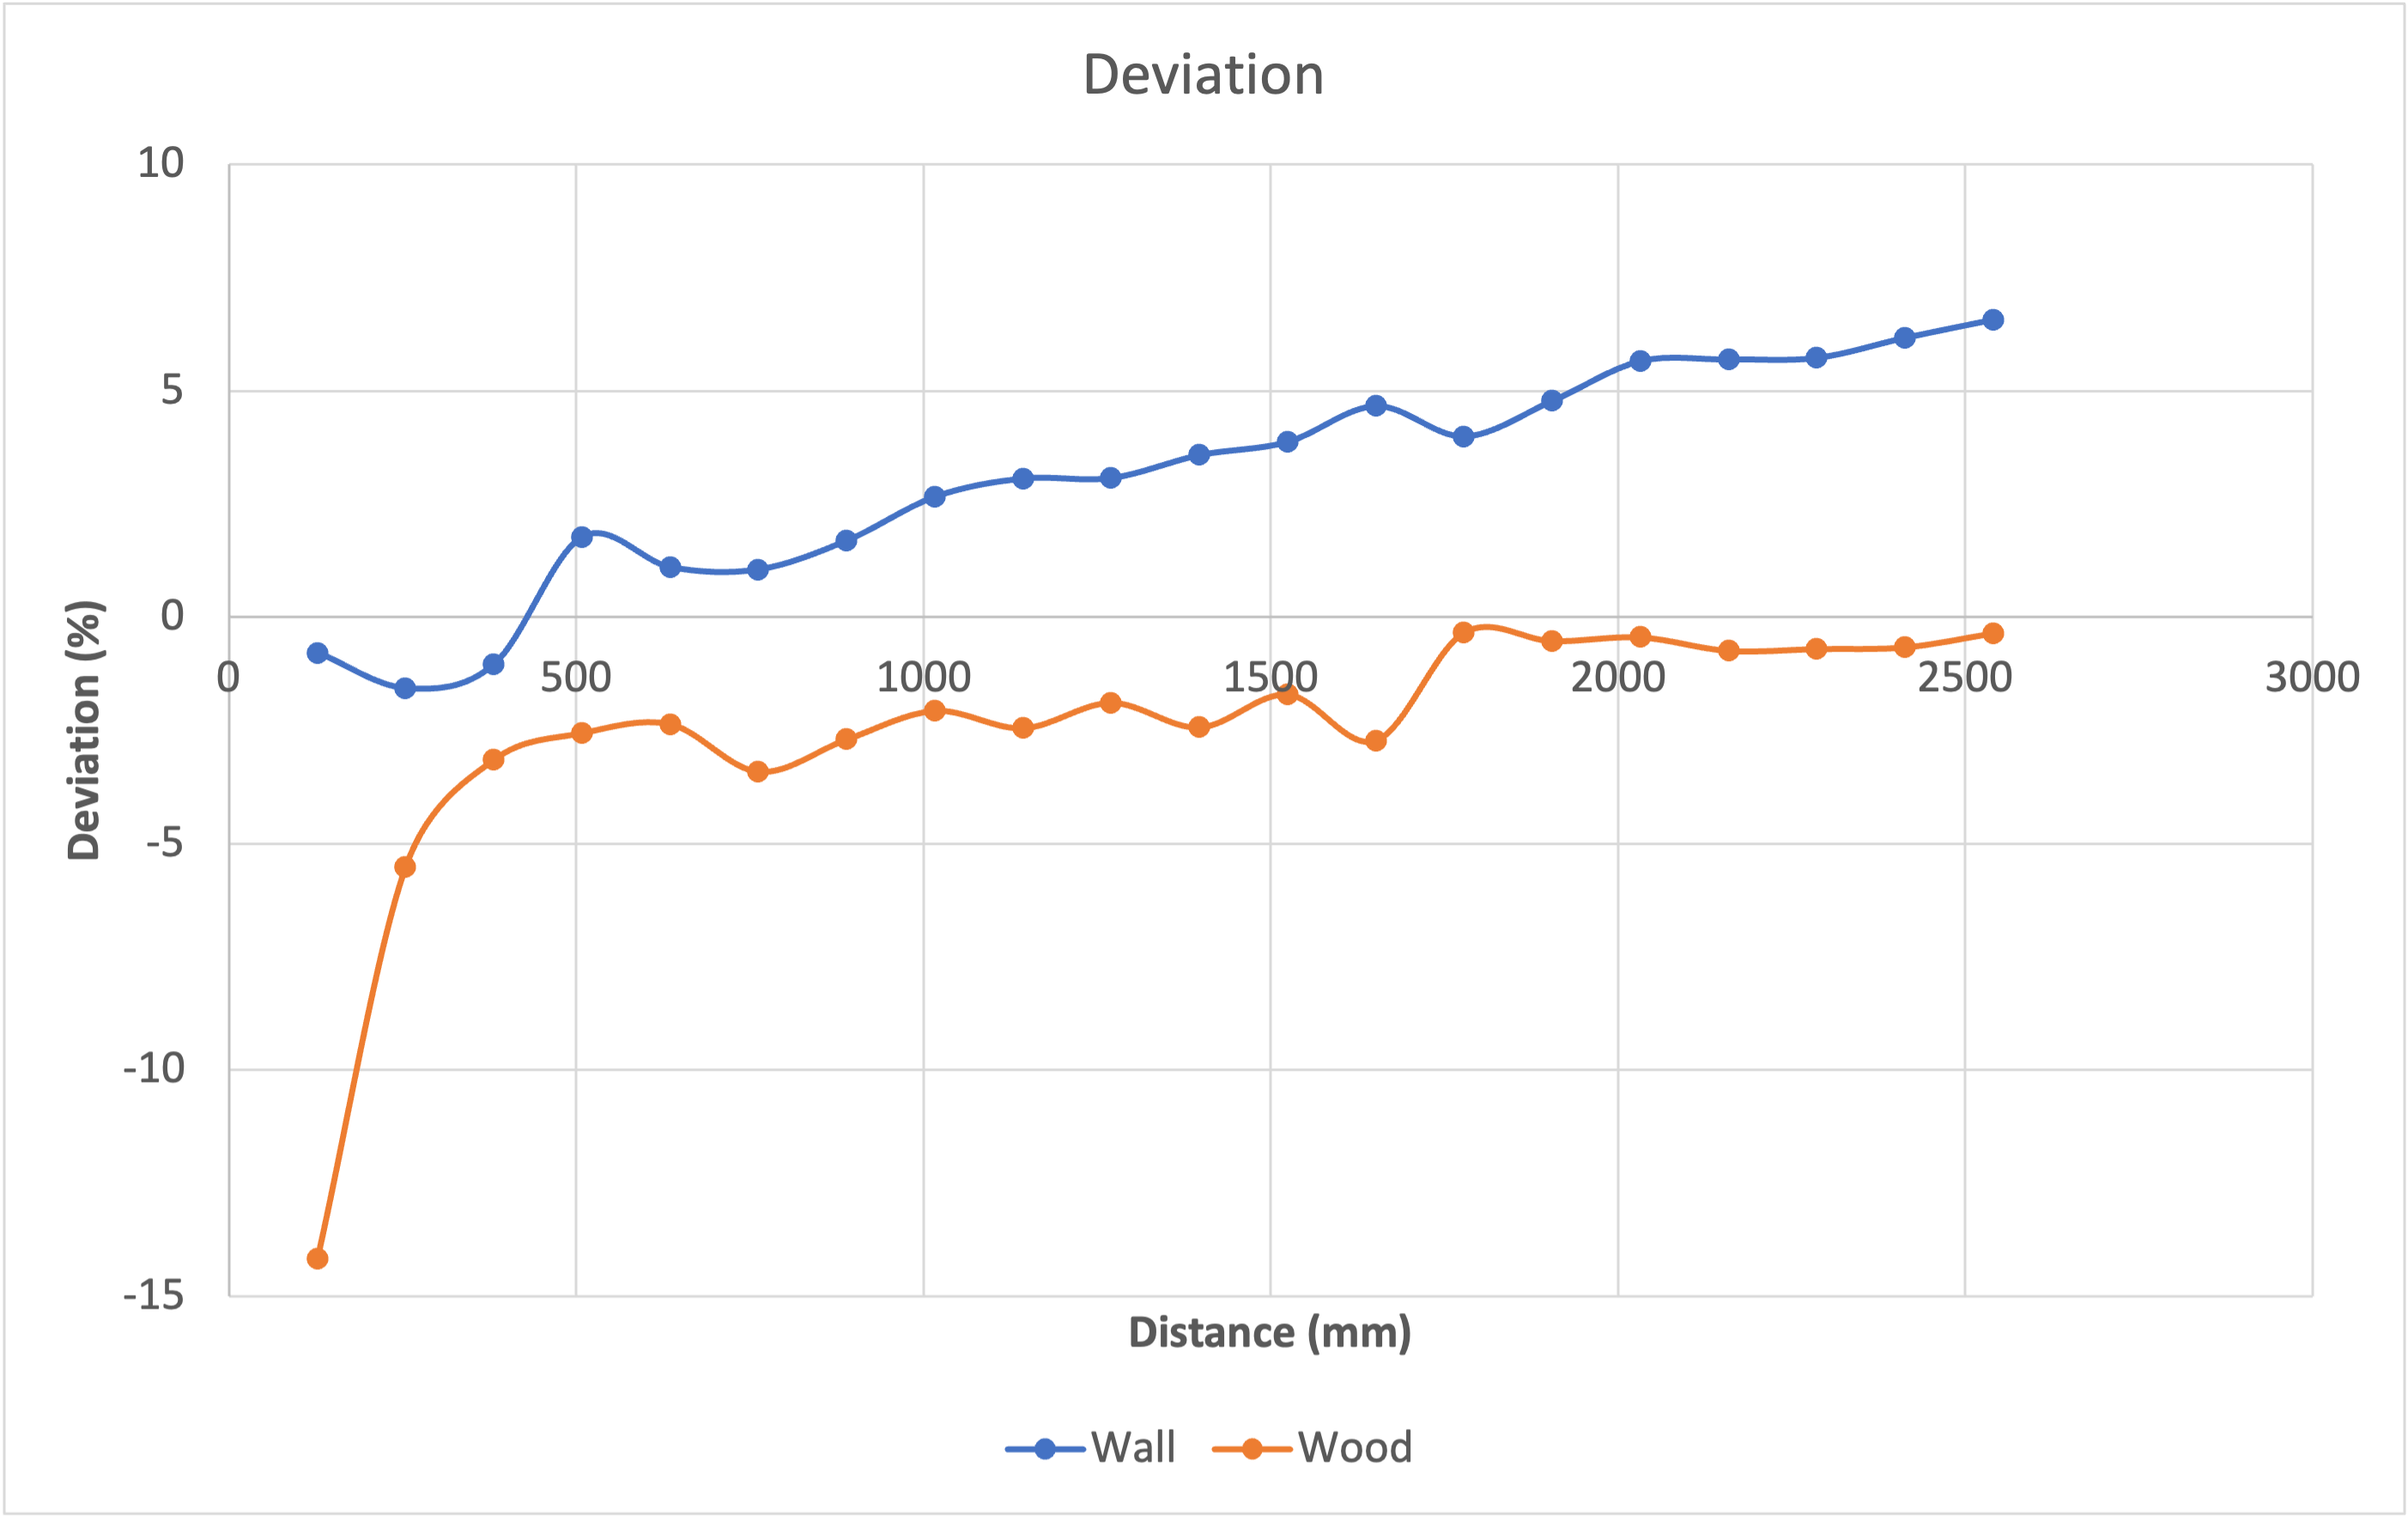
 The measured distance demonstrated a linear relationship within the distance range of 2500 mm in both cases. The distance measured against a white wall tends to deviate a bit more from the actual distance than the wooden door case, which might be due to the light reflection from the wall, but the overall difference is not obvious. The deviation of both cases is mostly lower than 4 % in the measurement range, while the wood case gets the distance data more precise as the disance goes longer. This can be explained by the effect from the long distance range mode.

-
By using the wire schematics described in the prelab section, I hooked up two ToF sensors and ran the ReadDistance example to prove they work as expected. Since two ToF sensors would share the same address, the shutdown pins of the ToF sensors are connected to GPIO pin 6 and 8 respectively to control the access to data at a time. In the video, I taped both sensors at the cover of my computer, and I set GPIO 6 to HIGH, GPIO 8 to LOW. GPIO 6 controls the shutdown pin of the sensor in the left when viewing from the side facing the sensors. As I blocked the left sensor with a black object, the distance detected decreased. On the other hand, nothing happened to the distance reading when I blocked the right sensor. I tested and got the same outcome from testing the right sensor.
Additional Tasks
-
Infrared-based distance sensors comparison.
(1) Amplitude-based IR sensor, such as VCNL4040, includes an infrared LED to transmit signal to the environment. The proximity sensor receives the reflected signal from the object, and calculates the distance between the sensor and the object. It is mostly a short-range sensor. Also, it is cheap and only requires simple circuitry for applications, but it is sensitive to surface colors, textures, and ambient light.
(2) Triangulation-based IR sensor measures the distance by calculating the difference in angles between the light reflected and the sensor surface. It is less sensitive to colors, textures, and ambient light compared to the amplitude-based sensors, but the cost per each is higher.
(3) Time of flight sensor emits a pulse modulated signal and records the time until the signal returns. It is mostly insensitive to colors, textures, and ambient light, and it collects different outputs other than distance measurements. -
Timing budget is the time required to perform one range measurement, and the intermeasurement period is the time delay between two ranging measurements. If the intermeasurement period is shorter than the timing budget, the next ranging operation runs immediately after the current ranging measurement completes. I tried the SetIntermesaurementPeriod example from the VL53L1X library to adjust different values for both timing budget and intermeasurement period. I first set both the timing budget and the intermeasurement period to 1 ms, which means the next measurment would start ranging right after current operation, and the ranging time period is 1 ms. The serial monitor failed to print out the outcome because the intermeasurement period is shorter than the minimum timing budget. Then, I set it to 20 ms, the minimum of the timing budget, and the measurement ran smoothly. The ranging is at 50 Hz under this setting, which is reasonable for the anticipated robot speed.

-
In this section, I explored the limit checking settings from signal and sigma. The signal rate measurement represents the amplitude of the signal reflected from the target and detected by the device. As for the sigma, it represents the estimation of the standard deviation of the measurement. By running the StatusAndRate example, I checked the signal rate and range status while changing the distance in front of the sensor. Mostly, the sensor is in good status when I tried to decrease the sensing distance by covering it by my finger. However, the status failed frequently if I tried to rotate the sensor. This might affect the sensing when the robot is doing stunt in the future, and the need to secure the wiring and sensor in place is definitely necessary.
<iframe width="560" height="315" src="https://www.youtube.com/embed/2Iwdqh7c9uM" title="YouTube video player" frameborder="0" allow="accelerometer; autoplay; clipboard-write; encrypted-media; gyroscope; picture-in-picture" allowfullscreen></iframe>
Part B: IMU
-
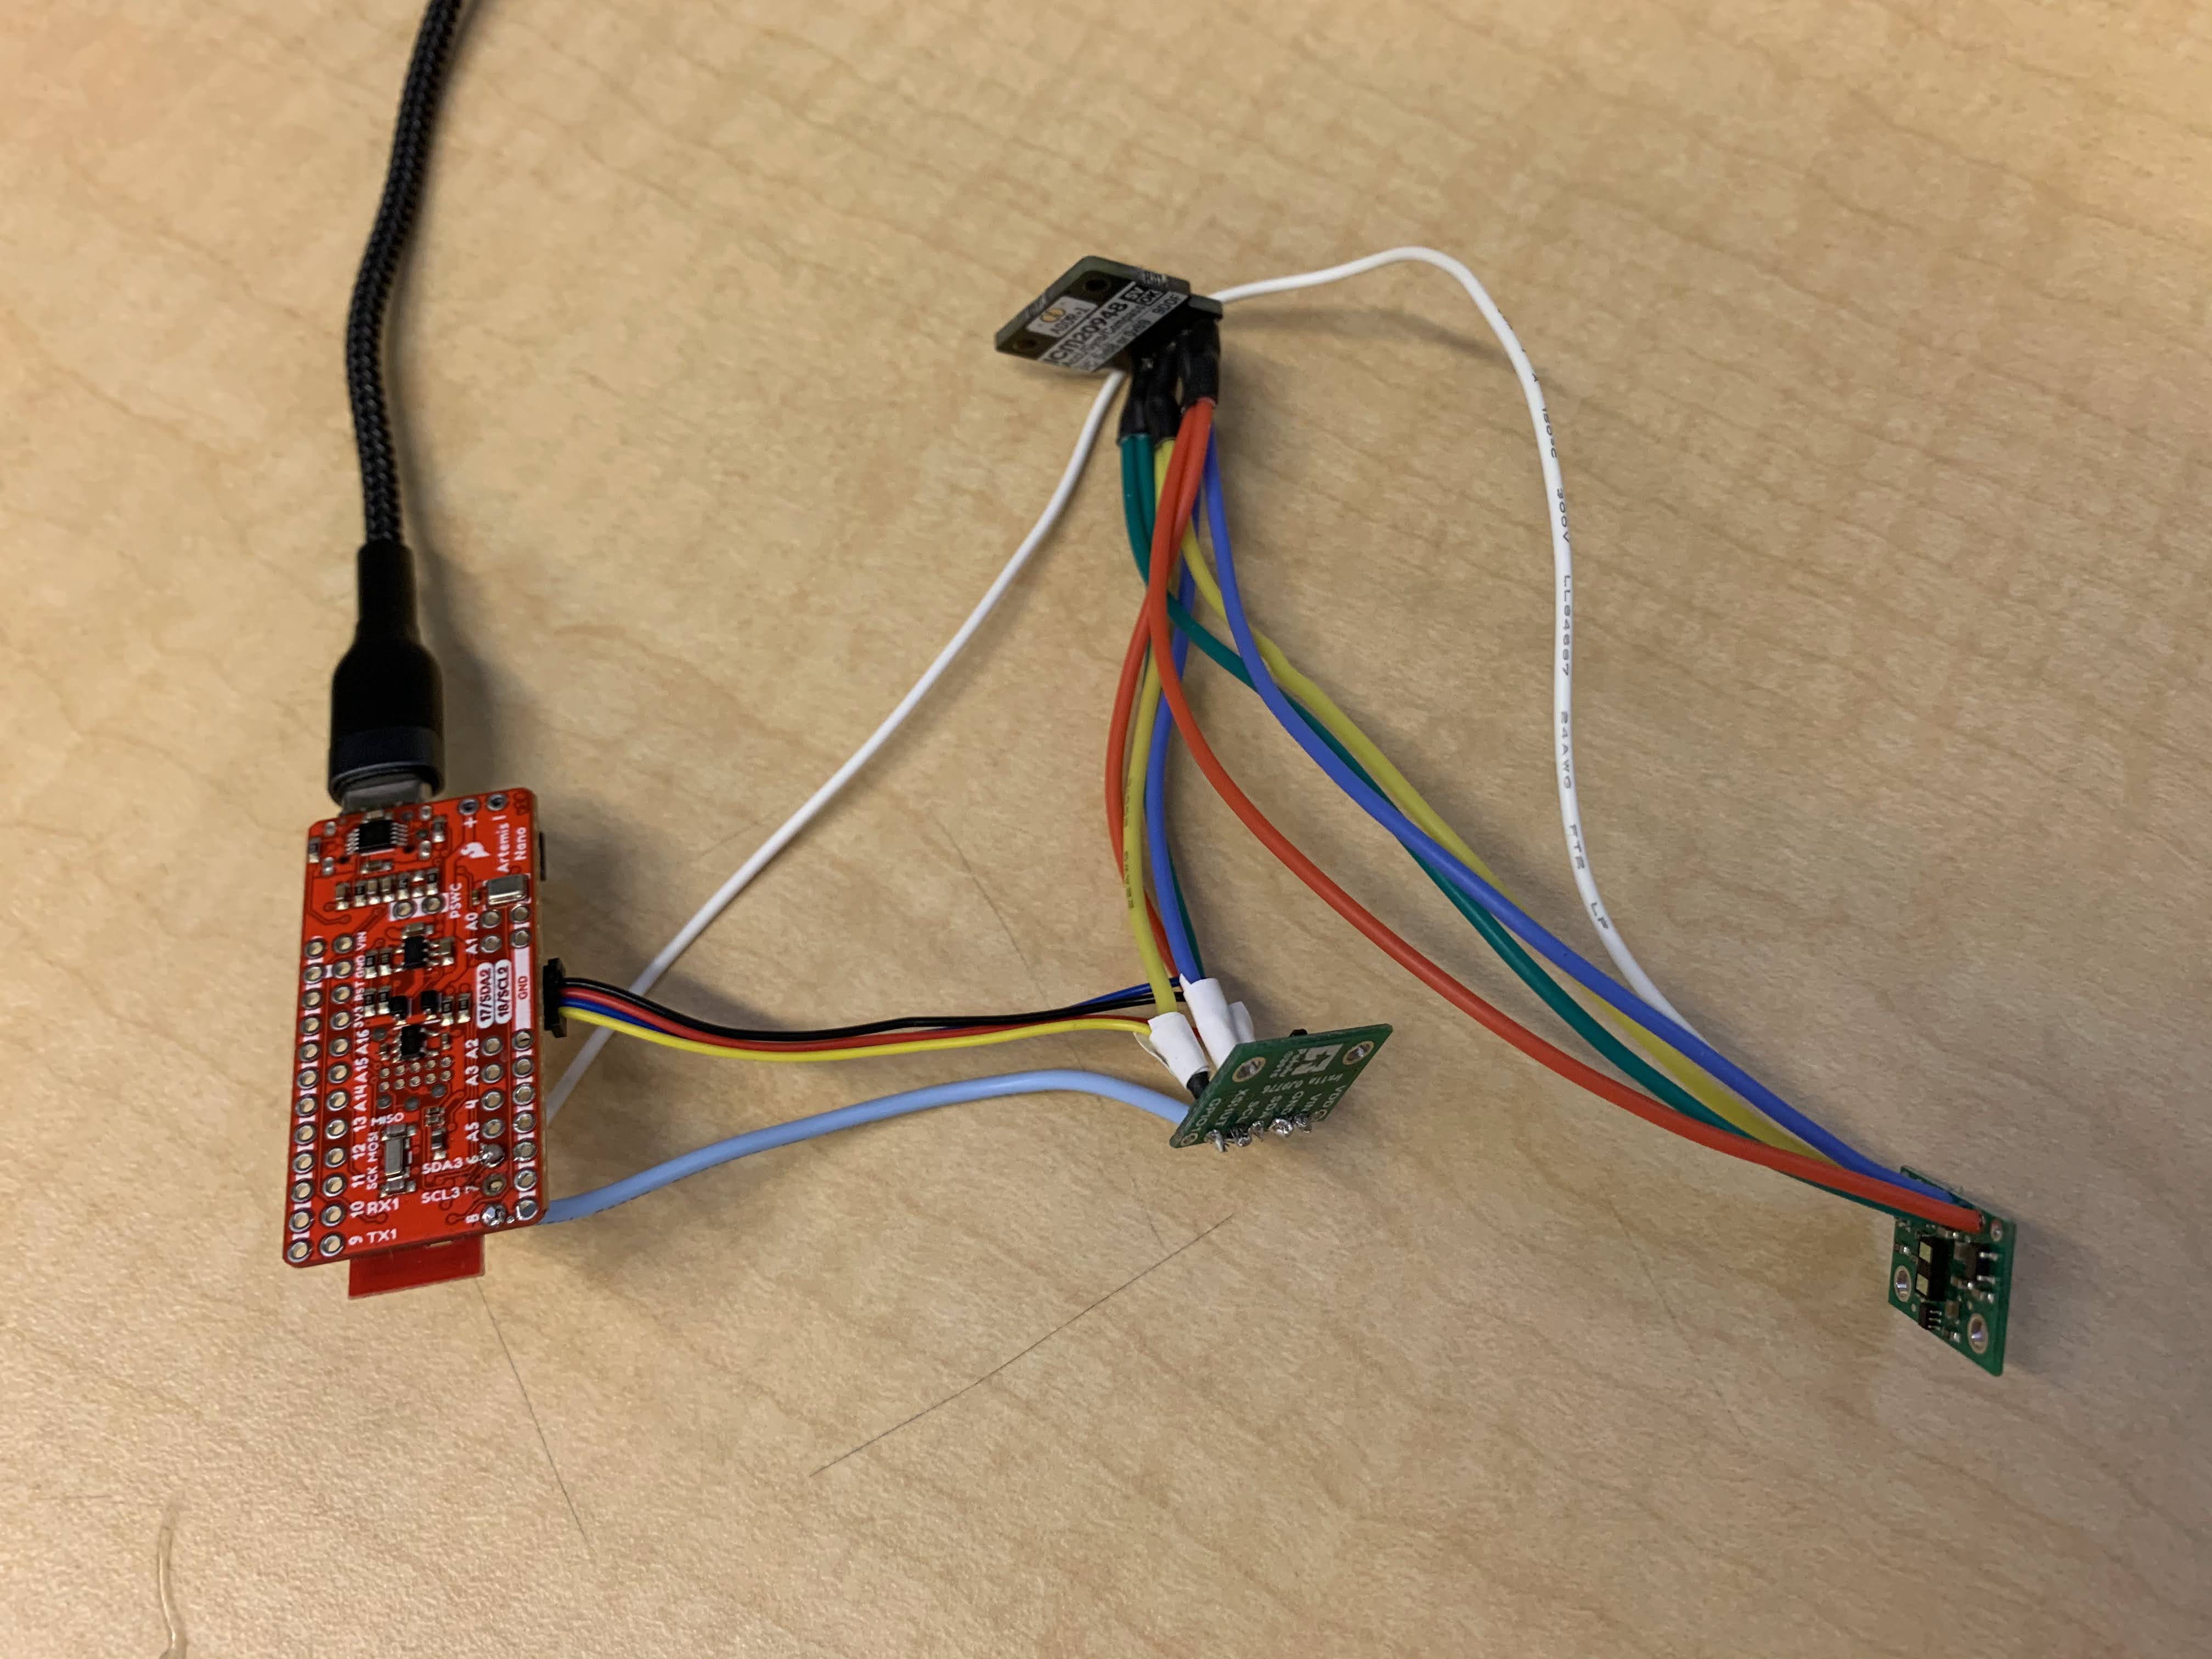
I soldered the IMU (ICM20948) to the wires that are already connected with the ToF sensors in part a. Below shows the complete wiring between the Artemis board, two ToF sensors, and one IMU unit.
-
I ran the Example1_Basics to test the functionality of the IMU. AD0_VAL represents the LSB of the 7-bit address of ICM-20948. By changing it from 1 (default) to 0, the address of the IMU unit switches from 0x69 to 0x68. I set this value to 0 since the IMU is hooked up with other sensor units. It needs the updated address to function with other sensors for communication. From the serial plotter in arduino, the sensor data from accelerometer changed drastically as I rotated or flipped the sensor. The sign of the output changed from positive to negative as I rotated it 180 degrees. As I accelerated the board, the accelerometer data showed a couple spikes in the output. However, the data from gyroscope didn’t change much during the whole testing. It only showed some huge change in the output right at the time I rotated or flipped the board.
(a) Accelerometer
- Refering to the material from the previous lecture, I found pitch by
  pitch = atan2(sensor->accX(),sensor->accZ())*180/M_PI;
  roll = atan2(sensor->accY(),sensor->accZ())*180/M_PI;
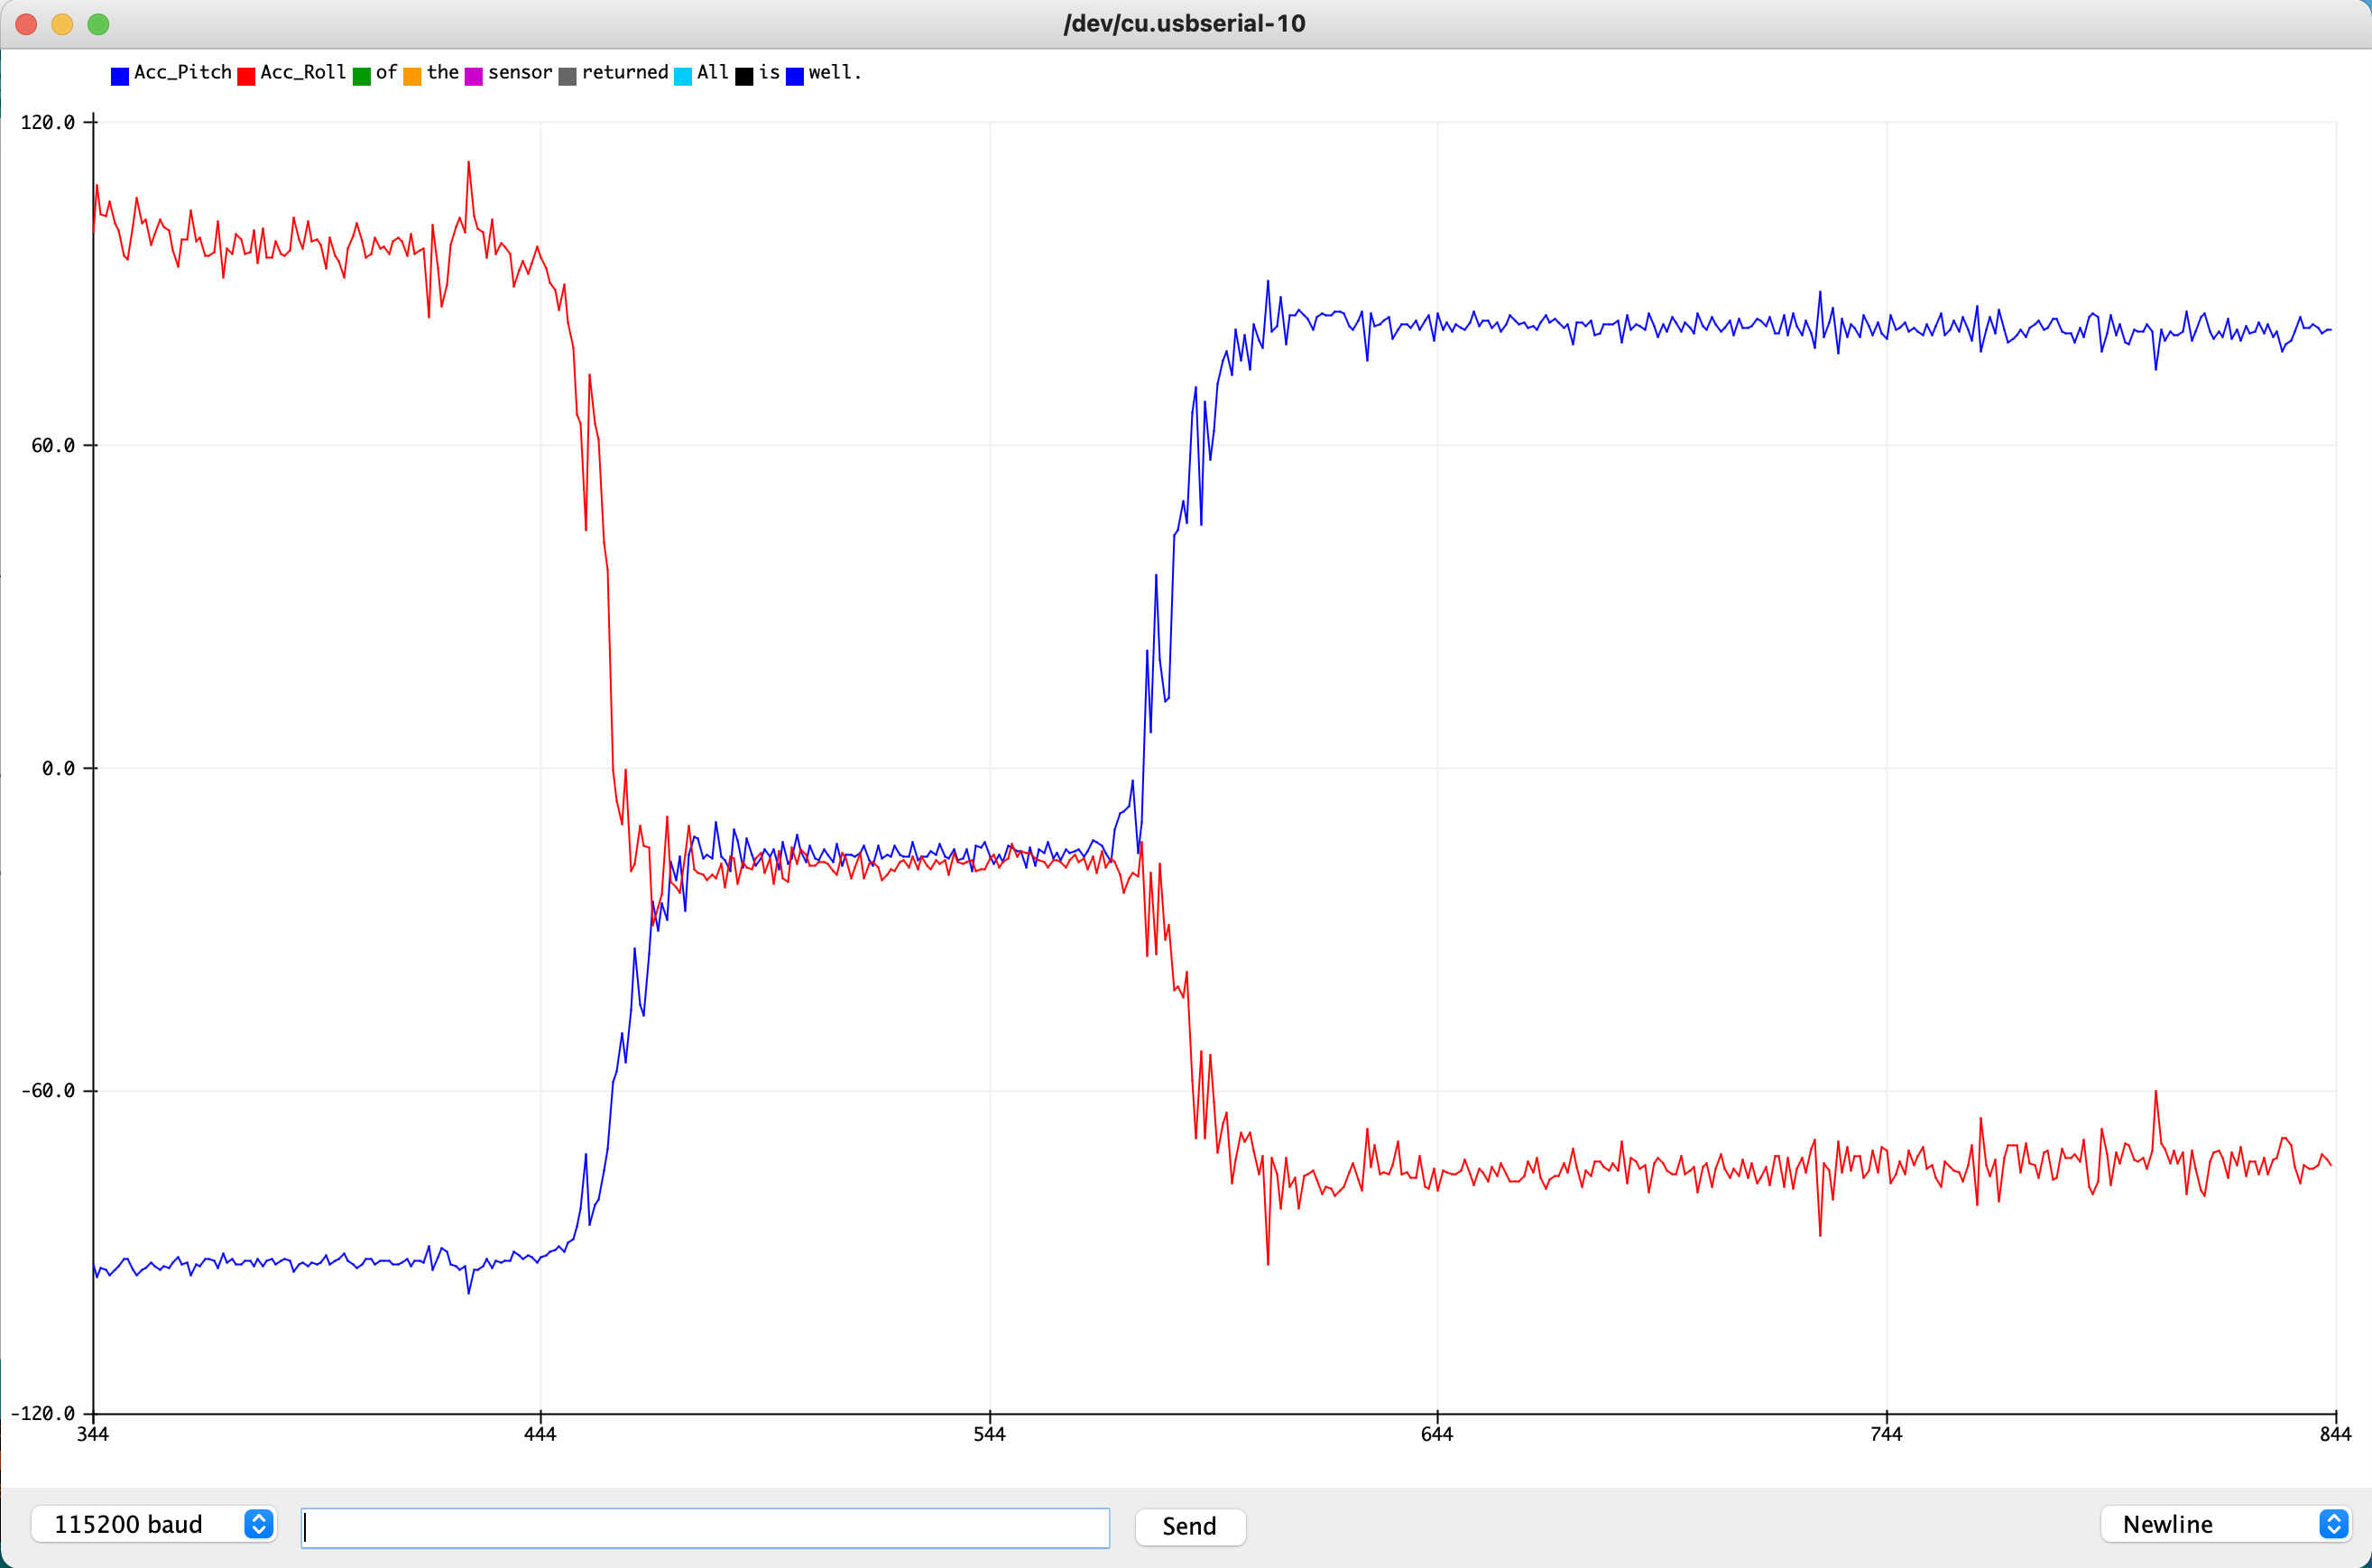
As I changed the angle of the board, the changes in pitch and roll changed as accordingly to my movement. Pitch data goes from -90 degrees to 90 degrees. The step in the middle is supposed to be 0 degree. However, the board seemed to be held slightly tilted against the table when I measured the data, so the outcome showed -10 degrees instaed of 0 as shown in the figure.
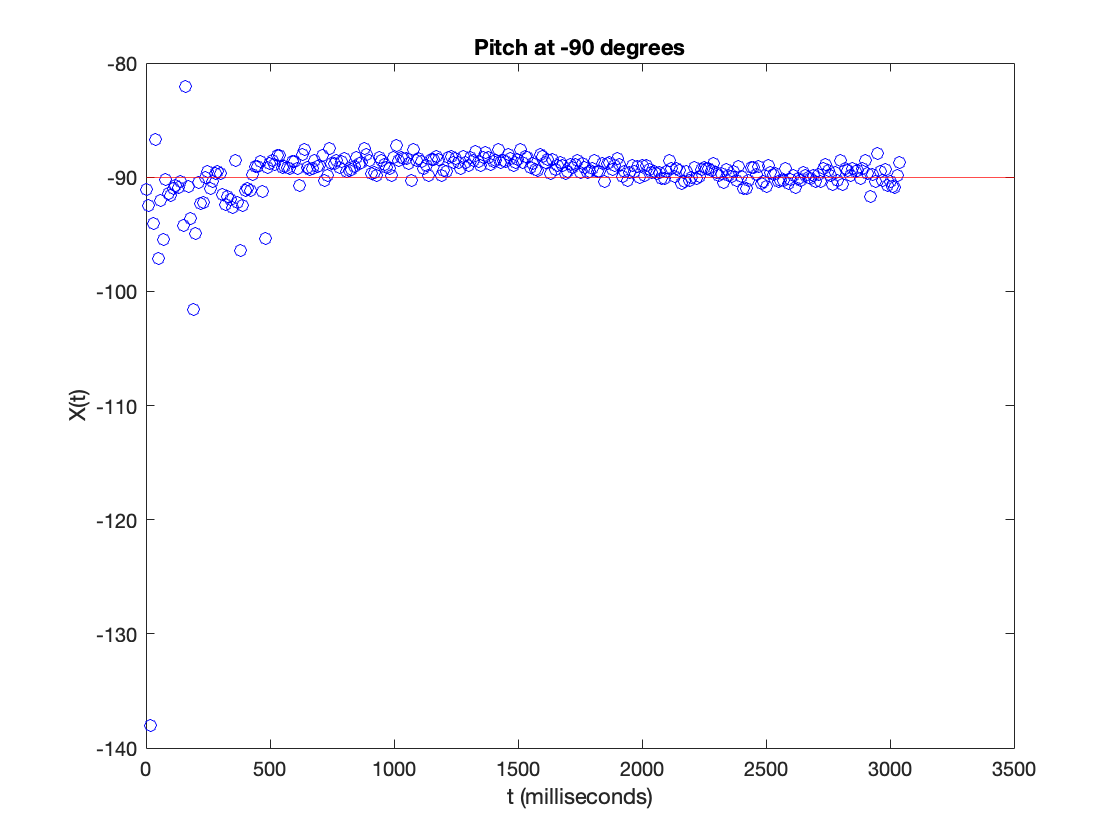
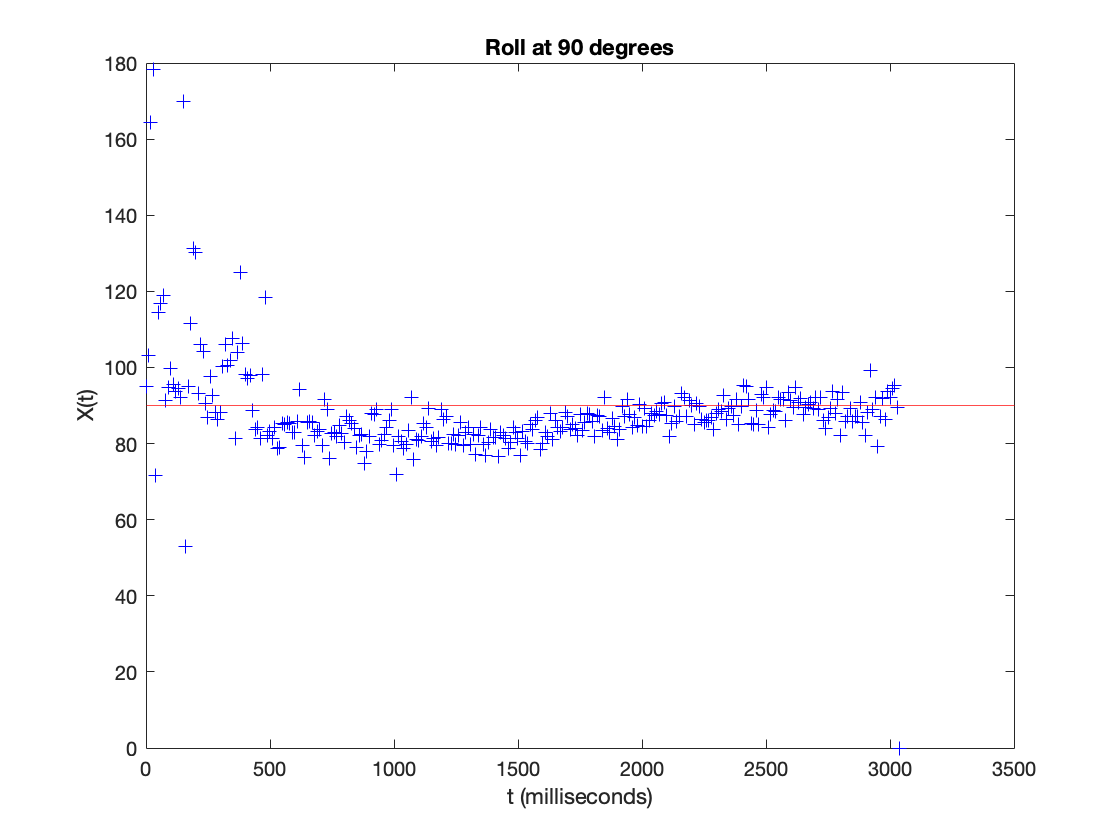
 As for the accuracy, I captured the pitch data at -90 degrees and roll data at 90 degrees to compare the difference betweem the measured data and the expected data. For the pitch data, the outcome is not stable in the beginning of the measurement, but it gets stable and accurate after 500 ms. As for the roll, the same issue shows up in the beginning of the measurement, and it tends to be smaller than 90 from 500 to 2000 ms. It gets more accrate after 2000 ms.
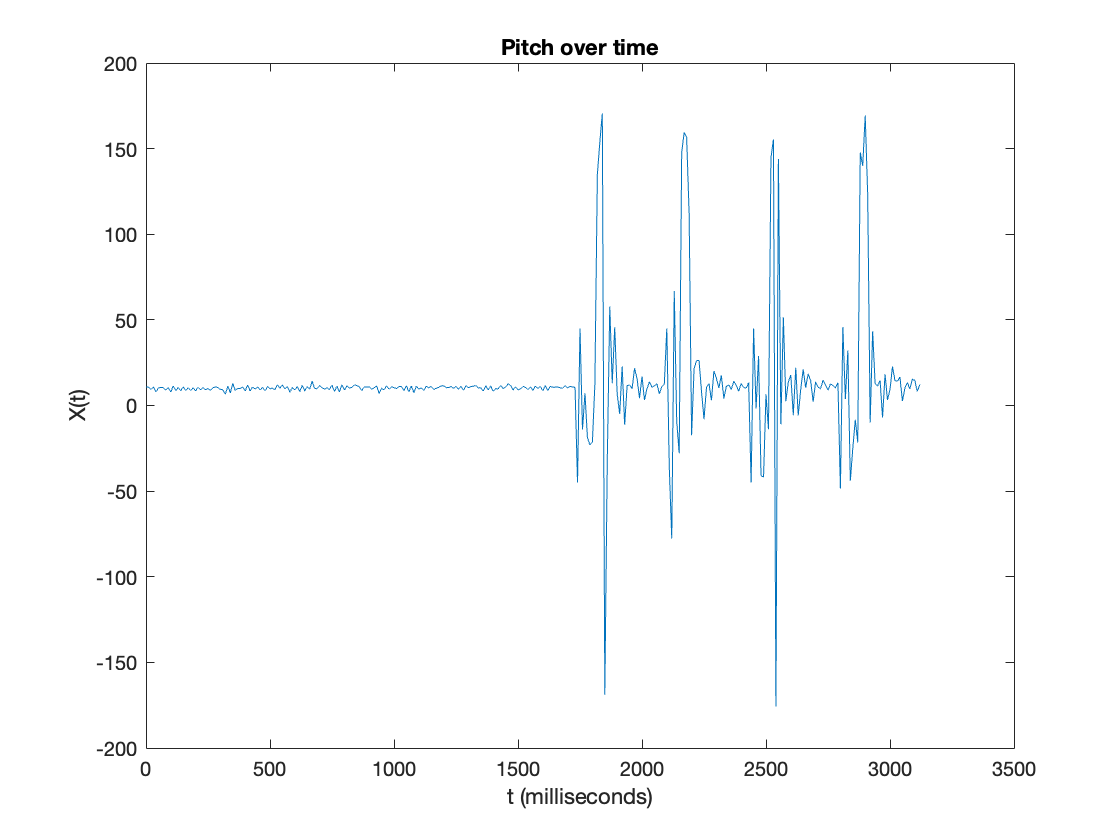
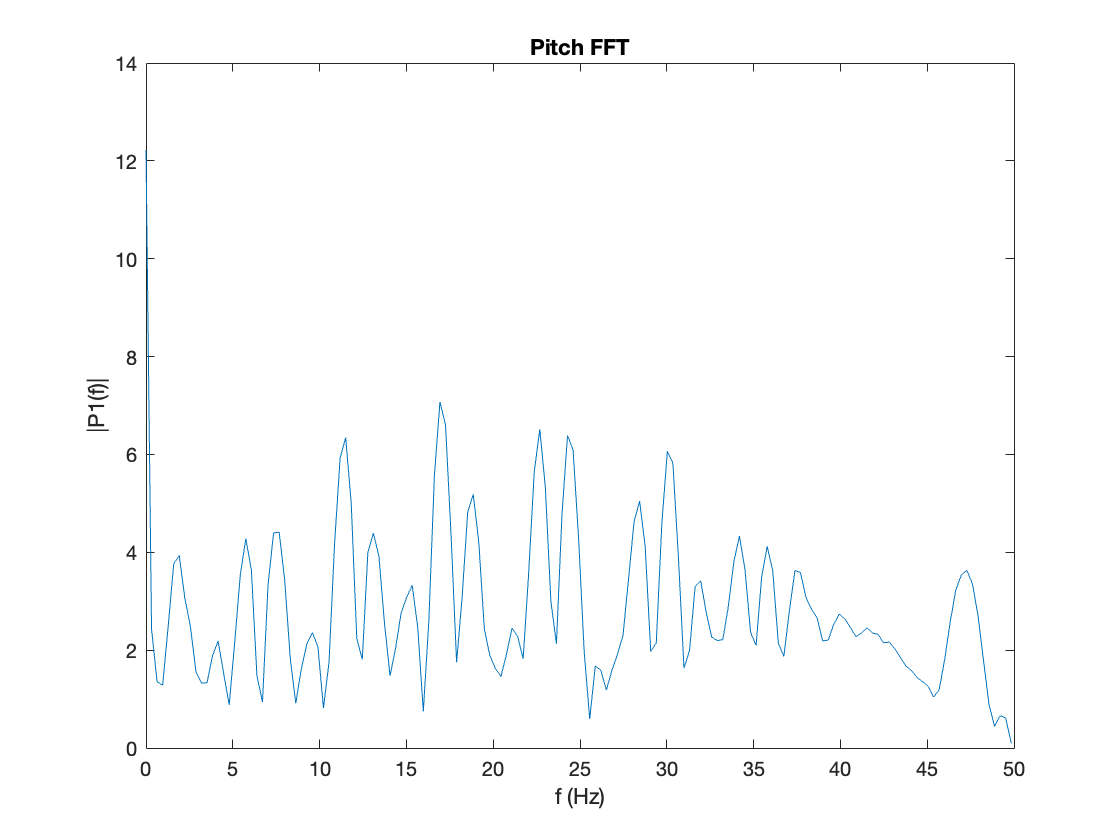
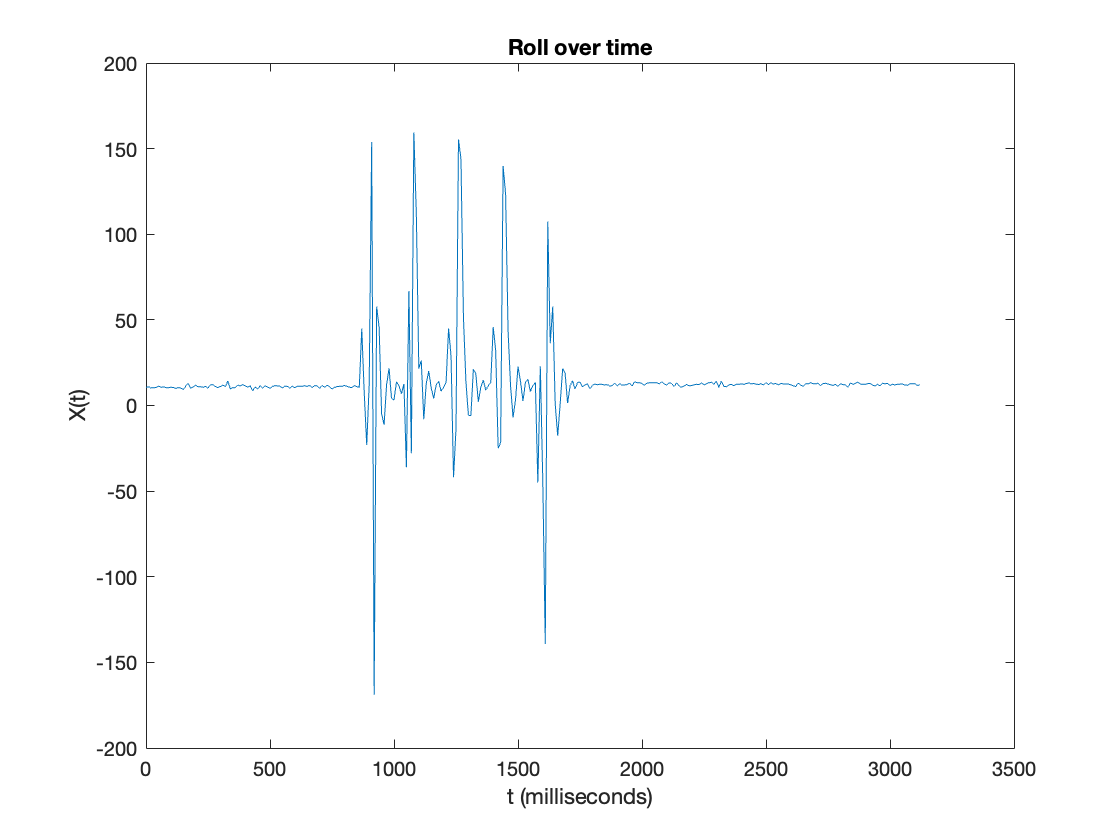
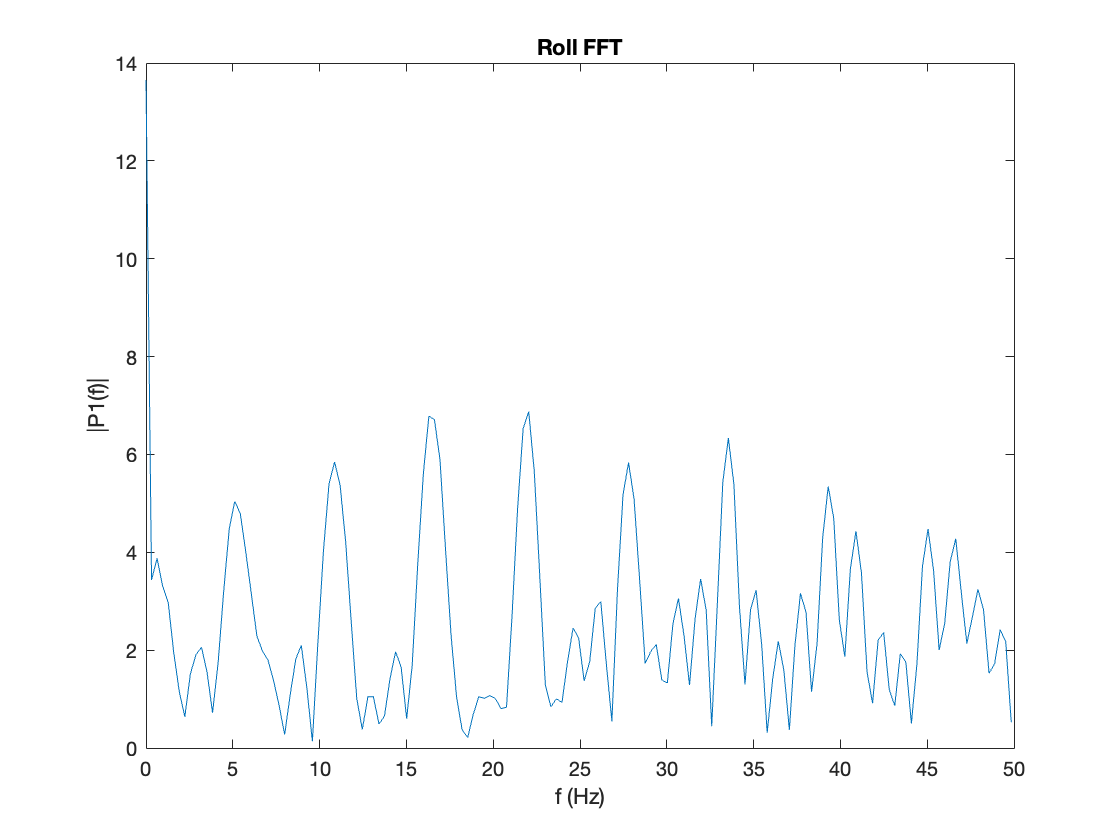
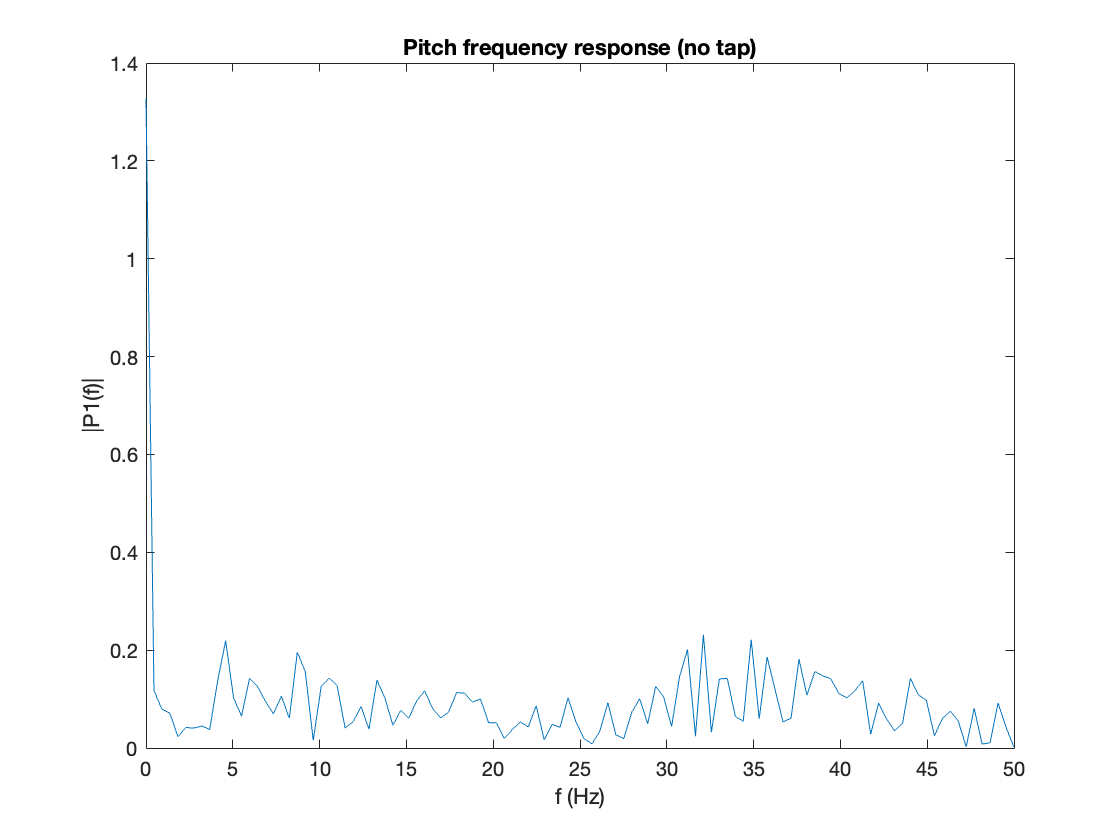
- For the frequency response to tapping, I set the time delay to 10 ms to increase the sampling frequency before the test. Then, I saved the pitch and roll data from serial monitor to txt files, and used MATLAB to plot the signal over time and the FFT response. Pitch and roll over time figures specify the limited noise region, which are the taps, in the overall data. For the pitch FFT figure in a noisy environment, it seems to show a couple spikes starting at 10 Hz. While the data before 10 Hz tends to have small spikes as well, thety are relatively small compared with the major spikes between 10 - 30 Hz. For the roll FFT figures, it’s more clear to see the noise starting from 3 Hz, and the following curves with similar trends might be the resonant noises from tapping. I also did the pitch frequency FFT without tapping to compare the result of the data, and it only shows a spike within the 3 Hz region. However, I chose the cut off frequency to be 10 Hz since it’s reasonable to have a decreasing amplitude trend in different frequencies until 10 Hz. The amplitude also hits minimum at 10 Hz.
 After choosing the cut off frequency, I got the RC constant as
 1/(2*M_PI*10), which can be further applied to the equation that calculates alpha for a complimentary low pass filter.alpha (a) = 0.018/(0.018+(1/(2*M_PI*25))); // 0.018 is the time period calculated by millis() pitch = (1-a) * pitch + a * (atan2(sensor->accX(),sensor->accZ())*180/M_PI); roll = (1-a) * roll + a * (atan2(sensor->accY(),sensor->accZ())*180/M_PI);Different cut off frequencies affect the frequency that’s been taken into consideration, and it’s nice to find the frequency with noises and filter them out to get a more stable signal output.
(b) Gyroscope
- Gyroscope measures the angular velocities along the three axes. I captured the actual time period by calculating the start and end time of each loop, and it turns out to be 18 ms. From the video, the data from the gyroscope seems less noisy but it tends to drift. Although the data from accelerometer is more noisy, the data remains relatively accurate since it still goes back to 0 degree when I turn the sensor back to flat.
  GRoll = GRoll + (sensor->gyrX())*((t-lastTime)/1000);
  GPitch = GPitch + (sensor->gyrY())*((t-lastTime)/1000);
  GYaw = GYaw + (sensor->gyrZ())*((t-lastTime)/1000);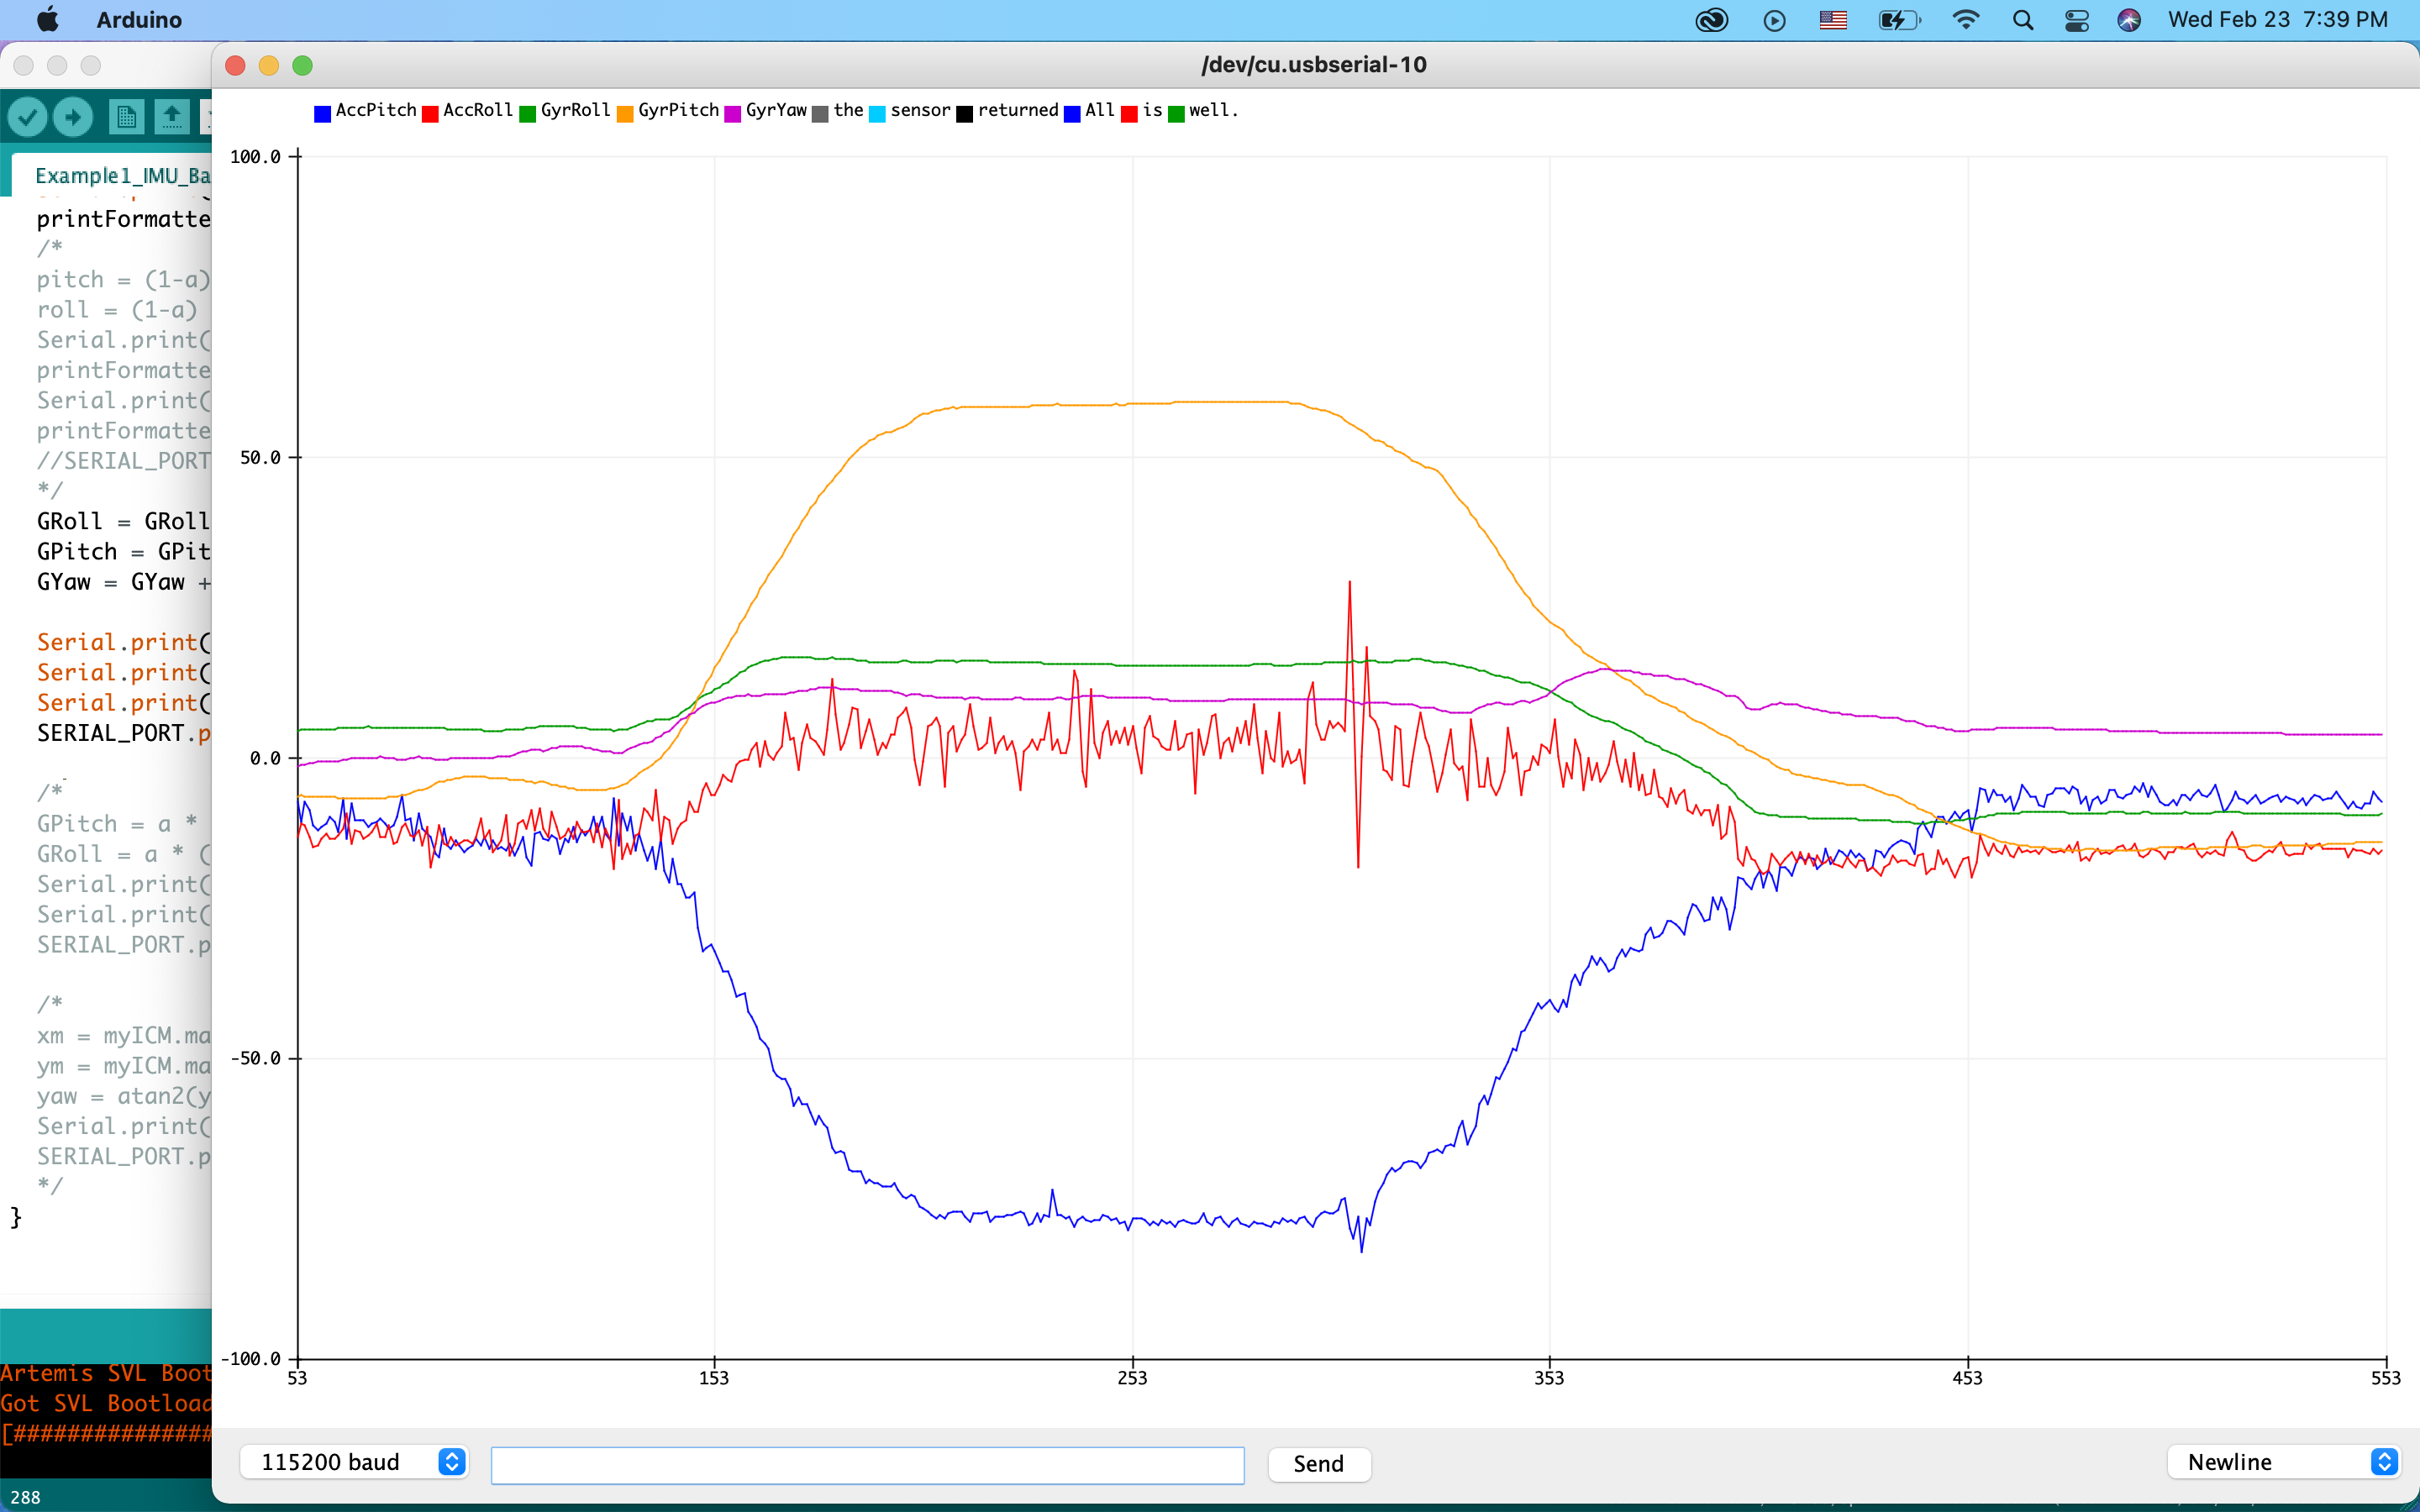
After decreasing the sampling frequency from 100 to 10 Hz, the signal seems more noisy in both accelerometer and gyroscope as I flip or rotate the board.
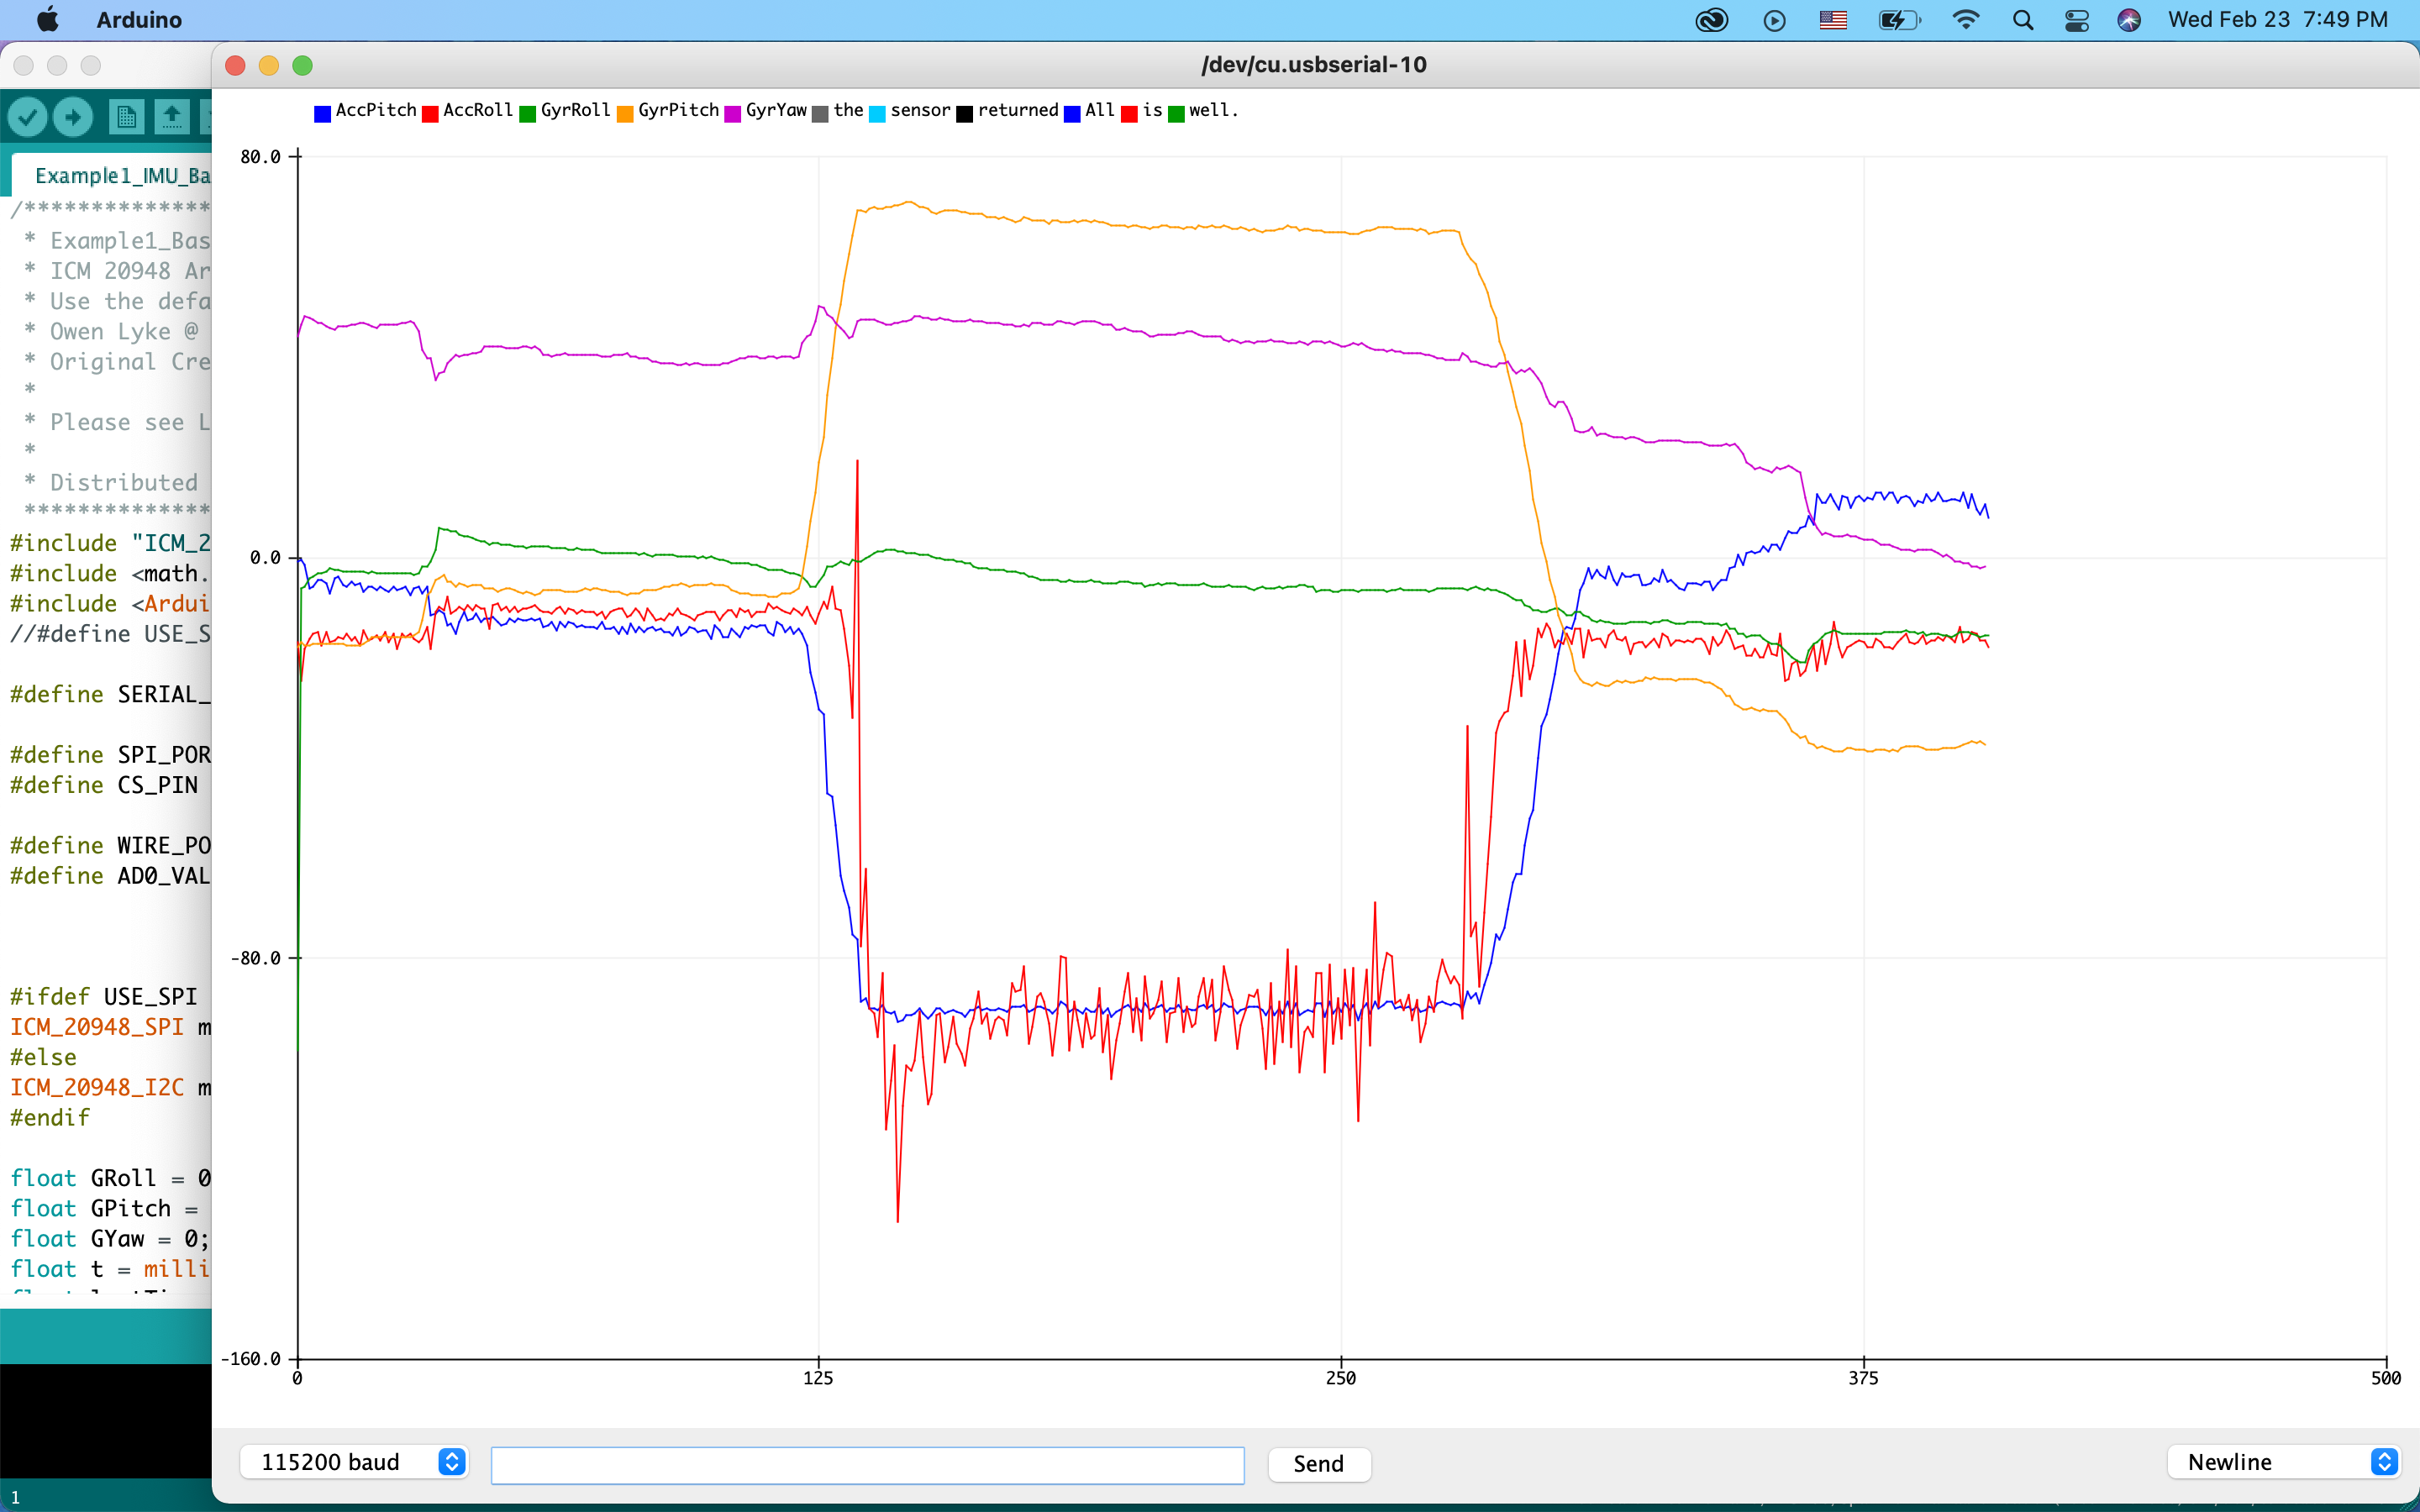
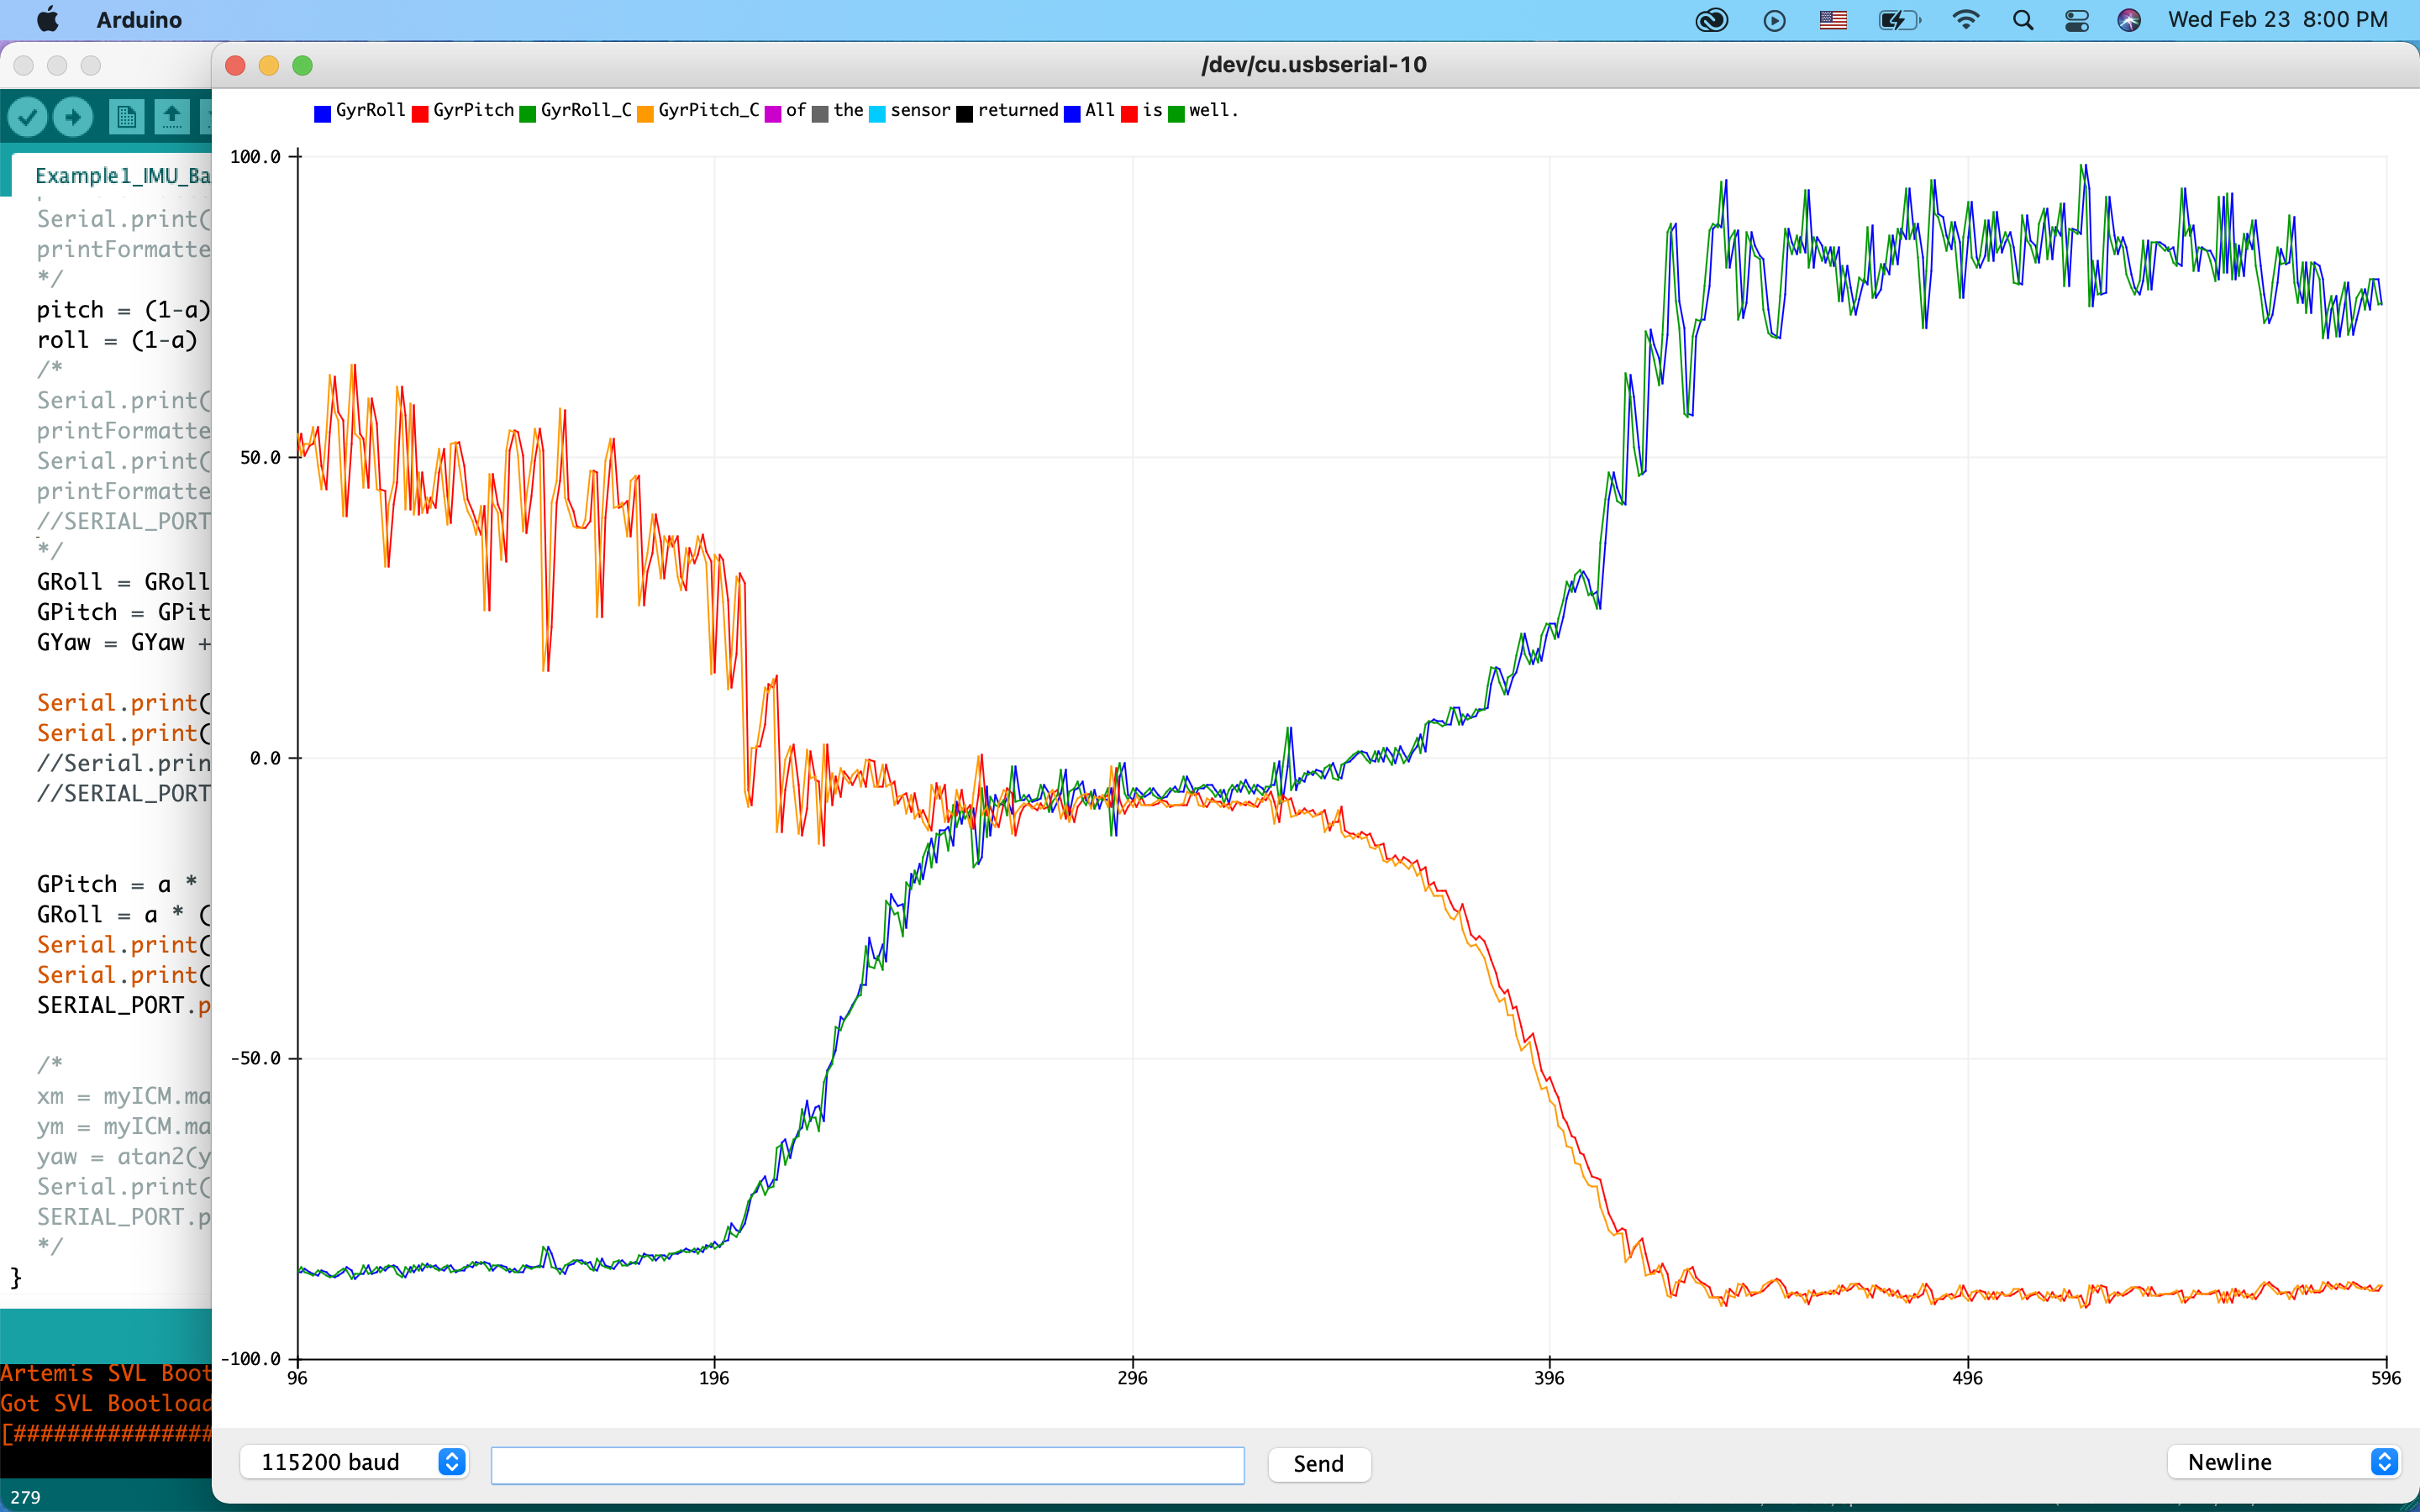
- I used the same alpha constant from the previous section to define a complimentary filter for pitch and roll in gyroscope, which is implemented by.
  GPitch = a * (GPitch + sensor->gyrY()*((t-lastTime)/1000)) + (1-a) * pitch;
  GRoll = a * (GRoll + sensor->gyrX()*((t-lastTime)/1000)) + (1-a) * roll;
From the figure, it doesn’t show that much difference between the data with or without the filter. This makes sense since the outcome without filter from the previous testings is already quite stable.
Additional Tasks
I used the provided equations to convert the magnetometer data into a yaw angle, and tried to find the magnetic north based on the outcome data. If I keep the IMU board horizontal and rotate it according to the z-axis, the magnetic north will be the direction with the highest data shown on the graph. I compared the yaw value from magnetometer with that from gyroscope as reference to define the direction. However, i didn’t see significant changes from magnetometer as I rotated the board. This may be due to the low reliability of magnetometer or the interference of other electronics in the room.
  xm = myICM.magX()*cos(pitch) - myICM.magY()*sin(roll)*sin(pitch) + myICM.magZ()*cos(roll)*sin(pitch); //these were saying theta=pitch and roll=phi
  ym = myICM.magY()*cos(roll) + myICM.magZ()*sin(roll*M_PI/180);
  yaw = atan2(ym, xm);